Introduction
When your system grows into multiple microservices, keeping track of everything becomes a challenge. You need to know when a service fails, when response times spike, and what logs reveal before users notice a problem. In distributed systems, a single request might touch dozens of services, making traditional monitoring approaches inadequate.
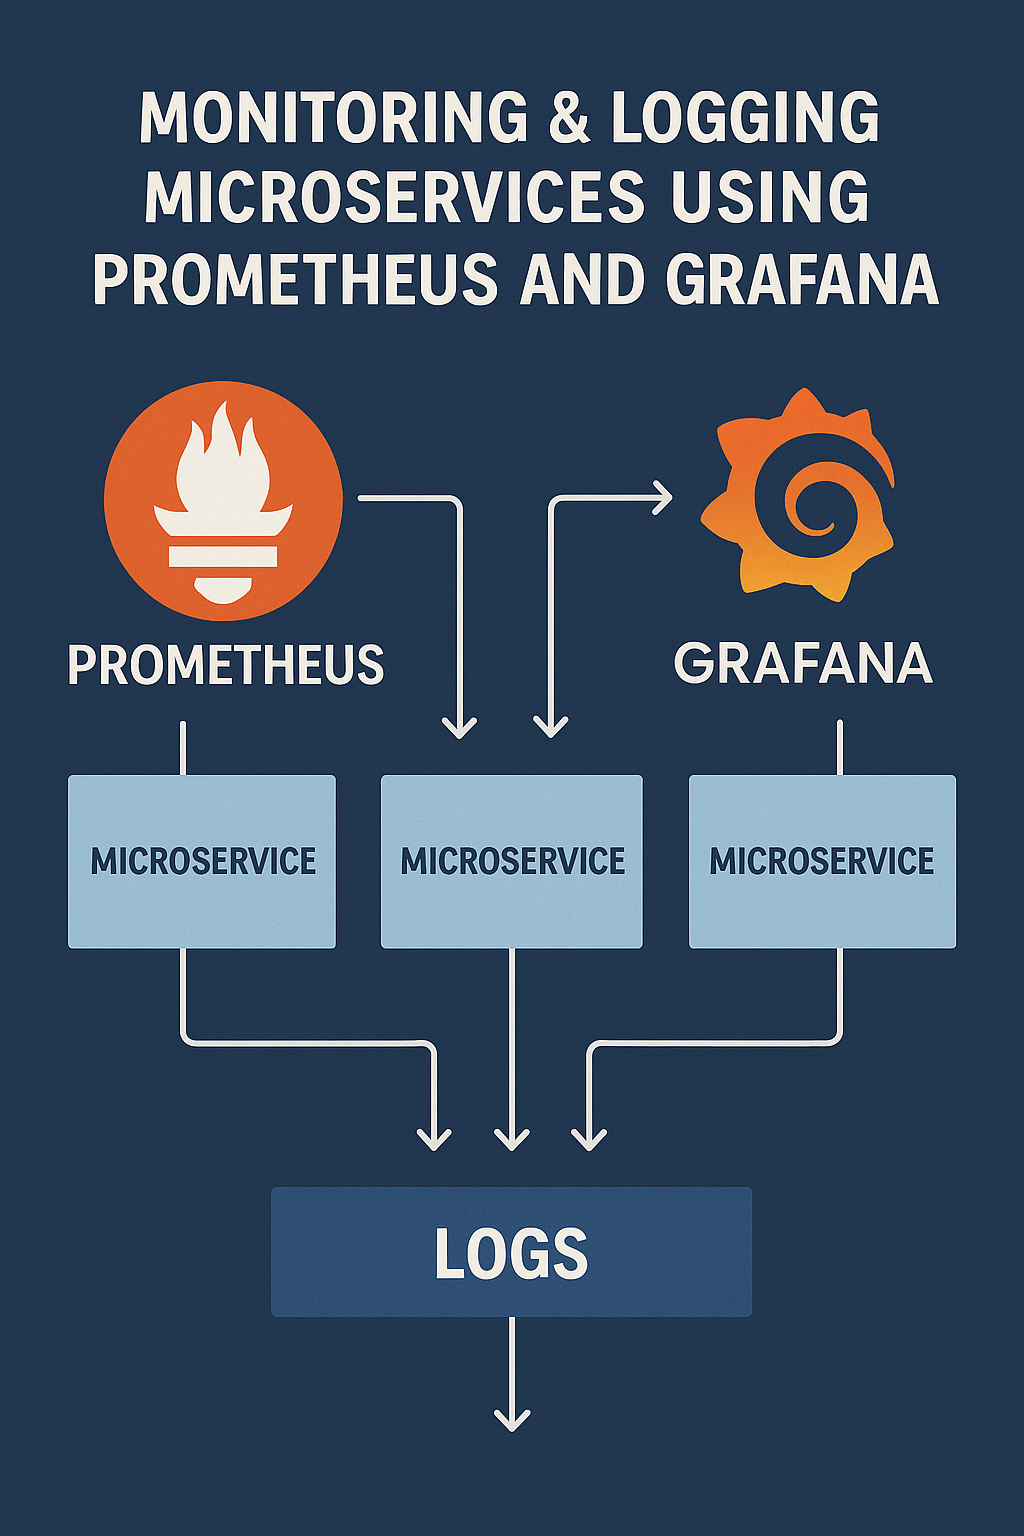
That’s where Prometheus and Grafana come in. Together, they form one of the most powerful open-source monitoring stacks for microservices. Prometheus handles metric collection and alerting, while Grafana transforms raw data into actionable visualizations.
In this comprehensive guide, you’ll learn how to set up a complete observability stack with Prometheus for data collection, Grafana for visualization, and Loki for log aggregation — plus production-ready configurations for alerting and dashboards.
Why Monitoring Microservices Is Critical
Microservices are distributed by nature. While this brings scalability, it also increases complexity exponentially.
Without proper monitoring:
- A single failed service can cause cascading errors across the entire system.
- Debugging becomes exponentially harder when logs are scattered across dozens of containers.
- Performance degradation may go unnoticed until production crashes.
- Capacity planning becomes guesswork without historical metrics.
- Mean Time To Recovery (MTTR) increases dramatically.
Monitoring gives you visibility. Logging gives you insight. Tracing gives you context. Combining all three ensures reliability and enables true observability.
The Three Pillars of Observability
# Observability Stack Overview
# ============================
#
# 1. METRICS (Prometheus)
#    - Numeric measurements over time
#    - CPU, memory, request rates, error counts
#    - Best for: alerting, dashboards, trends
#
# 2. LOGS (Loki/ELK)
#    - Event records with context
#    - Application events, errors, debug info
#    - Best for: debugging, audit trails
#
# 3. TRACES (Jaeger/Zipkin)
#    - Request flow across services
#    - Latency breakdown, service dependencies
#    - Best for: debugging distributed transactions
What Is Prometheus?
Prometheus is an open-source monitoring tool designed for collecting and storing time-series metrics. It uses a pull-based model, scraping data from your services using HTTP endpoints called exporters.
Key Features
- Time-series database optimized for metrics storage.
- Built-in alerting rules with Alertmanager integration.
- Powerful query language (PromQL) for complex aggregations.
- Service discovery for dynamic environments like Kubernetes.
- Easy integration with container platforms and cloud providers.
Prometheus Metric Types
# COUNTER - Only goes up (resets on restart)
# Use for: requests, errors, completed tasks
http_requests_total{service="orders", method="GET", status="200"} 3452

# GAUGE - Can go up or down
# Use for: temperature, memory usage, active connections
active_connections{service="orders"} 42

# HISTOGRAM - Samples observations into buckets
# Use for: request latency, response sizes
http_request_duration_seconds_bucket{le="0.1"} 2000
http_request_duration_seconds_bucket{le="0.5"} 2800
http_request_duration_seconds_bucket{le="1.0"} 2950
http_request_duration_seconds_sum 1234.5
http_request_duration_seconds_count 3000

# SUMMARY - Similar to histogram with quantiles
http_request_duration_seconds{quantile="0.5"} 0.05
http_request_duration_seconds{quantile="0.9"} 0.12
http_request_duration_seconds{quantile="0.99"} 0.25
Instrumenting Your Application
Node.js Express Example
// metrics.js - Prometheus metrics setup for Express
const express = require('express');
const client = require('prom-client');

// Create a Registry to register metrics
const register = new client.Registry();

// Add default metrics (CPU, memory, event loop lag)
client.collectDefaultMetrics({ register });

// Custom metrics
const httpRequestDuration = new client.Histogram({
  name: 'http_request_duration_seconds',
  help: 'Duration of HTTP requests in seconds',
  labelNames: ['method', 'route', 'status_code'],
  buckets: [0.01, 0.05, 0.1, 0.5, 1, 2, 5]
});
register.registerMetric(httpRequestDuration);

const httpRequestsTotal = new client.Counter({
  name: 'http_requests_total',
  help: 'Total number of HTTP requests',
  labelNames: ['method', 'route', 'status_code']
});
register.registerMetric(httpRequestsTotal);

const activeConnections = new client.Gauge({
  name: 'active_connections',
  help: 'Number of active connections'
});
register.registerMetric(activeConnections);

// Middleware to track request metrics
function metricsMiddleware(req, res, next) {
  const start = Date.now();
  activeConnections.inc();

  res.on('finish', () => {
    const duration = (Date.now() - start) / 1000;
    const route = req.route?.path || req.path;

    httpRequestDuration.observe(
      { method: req.method, route, status_code: res.statusCode },
      duration
    );

    httpRequestsTotal.inc({
      method: req.method,
      route,
      status_code: res.statusCode
    });

    activeConnections.dec();
  });

  next();
}

// Metrics endpoint
const metricsRouter = express.Router();
metricsRouter.get('/metrics', async (req, res) => {
  res.set('Content-Type', register.contentType);
  res.end(await register.metrics());
});

module.exports = { metricsMiddleware, metricsRouter, register };
// app.js - Using the metrics middleware
const express = require('express');
const { metricsMiddleware, metricsRouter } = require('./metrics');
const app = express();
// Apply metrics middleware to all routes
app.use(metricsMiddleware);
// Mount metrics endpoint
app.use(metricsRouter);
// Your application routes
app.get('/api/orders', async (req, res) => {
// Business logic
res.json({ orders: [] });
});
app.get('/api/users/:id', async (req, res) => {
// Business logic
res.json({ user: { id: req.params.id } });
});
app.listen(8080, () => {
console.log('Server running on port 8080');
console.log('Metrics available at /metrics');
});Python Flask Example
# metrics.py - Prometheus metrics for Flask
from prometheus_client import Counter, Histogram, Gauge, generate_latest, REGISTRY
from functools import wraps
import time

# Define metrics
REQUEST_COUNT = Counter(
    'http_requests_total',
    'Total HTTP requests',
    ['method', 'endpoint', 'status']
)

REQUEST_LATENCY = Histogram(
    'http_request_duration_seconds',
    'HTTP request latency',
    ['method', 'endpoint'],
    buckets=[0.01, 0.05, 0.1, 0.5, 1.0, 2.0, 5.0]
)

IN_PROGRESS = Gauge(
    'http_requests_in_progress',
    'HTTP requests in progress',
    ['method', 'endpoint']
)

def track_requests(func):
    @wraps(func)
    def wrapper(*args, **kwargs):
        from flask import request
        method = request.method
        endpoint = request.endpoint or 'unknown'

        IN_PROGRESS.labels(method=method, endpoint=endpoint).inc()
        start_time = time.time()

        try:
            response = func(*args, **kwargs)
            status = response.status_code if hasattr(response, 'status_code') else 200
            return response
        except Exception as e:
            status = 500
            raise
        finally:
            duration = time.time() - start_time
            REQUEST_COUNT.labels(method=method, endpoint=endpoint, status=status).inc()
            REQUEST_LATENCY.labels(method=method, endpoint=endpoint).observe(duration)
            IN_PROGRESS.labels(method=method, endpoint=endpoint).dec()

    return wrapper
# app.py - Flask application with Prometheus metrics
from flask import Flask, jsonify
from prometheus_client import generate_latest, CONTENT_TYPE_LATEST
from metrics import track_requests
app = Flask(__name__)
@app.route('/metrics')
def metrics():
return generate_latest(), 200, {'Content-Type': CONTENT_TYPE_LATEST}
@app.route('/api/orders')
@track_requests
def get_orders():
return jsonify({'orders': []})
@app.route('/api/users/<user_id>')
@track_requests
def get_user(user_id):
return jsonify({'user': {'id': user_id}})
if __name__ == '__main__':
app.run(host='0.0.0.0', port=8080)Prometheus Configuration
# prometheus.yml - Production configuration
global:
  scrape_interval: 15s
  evaluation_interval: 15s
  external_labels:
    cluster: 'production'
    region: 'us-east-1'

# Alertmanager configuration
alerting:
  alertmanagers:
    - static_configs:
        - targets:
          - alertmanager:9093

# Load alerting rules
rule_files:
  - '/etc/prometheus/rules/*.yml'

scrape_configs:
  # Prometheus self-monitoring
  - job_name: 'prometheus'
    static_configs:
      - targets: ['localhost:9090']

  # Application services
  - job_name: 'microservices'
    metrics_path: /metrics
    static_configs:
      - targets:
        - 'orders-service:8080'
        - 'users-service:8080'
        - 'payments-service:8080'
        - 'inventory-service:8080'
    relabel_configs:
      - source_labels: [__address__]
        regex: '([^:]+):.*'
        target_label: service
        replacement: '${1}'

  # Kubernetes service discovery
  - job_name: 'kubernetes-pods'
    kubernetes_sd_configs:
      - role: pod
    relabel_configs:
      # Only scrape pods with prometheus.io/scrape annotation
      - source_labels: [__meta_kubernetes_pod_annotation_prometheus_io_scrape]
        action: keep
        regex: true
      # Use custom metrics path if specified
      - source_labels: [__meta_kubernetes_pod_annotation_prometheus_io_path]
        action: replace
        target_label: __metrics_path__
        regex: (.+)
      # Use custom port if specified
      - source_labels: [__address__, __meta_kubernetes_pod_annotation_prometheus_io_port]
        action: replace
        regex: ([^:]+)(?::\d+)?;(\d+)
        replacement: $1:$2
        target_label: __address__
      # Add pod labels
      - action: labelmap
        regex: __meta_kubernetes_pod_label_(.+)

  # Node exporter for host metrics
  - job_name: 'node-exporter'
    static_configs:
      - targets:
        - 'node-exporter:9100'
Alerting Rules
# /etc/prometheus/rules/alerts.yml
groups:
  - name: service-alerts
    rules:
      # High error rate alert
      - alert: HighErrorRate
        expr: |
          sum(rate(http_requests_total{status_code=~"5.."}[5m])) by (service)
          /
          sum(rate(http_requests_total[5m])) by (service)
          > 0.05
        for: 5m
        labels:
          severity: critical
        annotations:
          summary: "High error rate on {{ $labels.service }}"
          description: "Error rate is {{ $value | humanizePercentage }} for {{ $labels.service }}"

      # High latency alert
      - alert: HighLatency
        expr: |
          histogram_quantile(0.95,
            sum(rate(http_request_duration_seconds_bucket[5m])) by (le, service)
          ) > 1
        for: 5m
        labels:
          severity: warning
        annotations:
          summary: "High latency on {{ $labels.service }}"
          description: "P95 latency is {{ $value | humanizeDuration }} for {{ $labels.service }}"

      # Service down alert
      - alert: ServiceDown
        expr: up == 0
        for: 1m
        labels:
          severity: critical
        annotations:
          summary: "Service {{ $labels.job }} is down"
          description: "{{ $labels.instance }} has been down for more than 1 minute"

      # High memory usage
      - alert: HighMemoryUsage
        expr: |
          (process_resident_memory_bytes / 1024 / 1024) > 500
        for: 10m
        labels:
          severity: warning
        annotations:
          summary: "High memory usage on {{ $labels.job }}"
          description: "Memory usage is {{ $value | humanize }}MB"

  - name: slo-alerts
    rules:
      # SLO: 99.9% availability
      - alert: SLOAvailabilityBreach
        expr: |
          1 - (
            sum(rate(http_requests_total{status_code!~"5.."}[1h]))
            /
            sum(rate(http_requests_total[1h]))
          ) > 0.001
        for: 5m
        labels:
          severity: critical
          slo: availability
        annotations:
          summary: "SLO availability breach"
          description: "Availability is below 99.9% SLO"
Grafana Setup and Dashboards
Docker Compose Setup
# docker-compose.yml - Complete monitoring stack
version: '3.8'

services:
  prometheus:
    image: prom/prometheus:v2.47.0
    container_name: prometheus
    ports:
      - "9090:9090"
    volumes:
      - ./prometheus/prometheus.yml:/etc/prometheus/prometheus.yml
      - ./prometheus/rules:/etc/prometheus/rules
      - prometheus_data:/prometheus
    command:
      - '--config.file=/etc/prometheus/prometheus.yml'
      - '--storage.tsdb.path=/prometheus'
      - '--storage.tsdb.retention.time=15d'
      - '--web.enable-lifecycle'
    restart: unless-stopped

  grafana:
    image: grafana/grafana:10.1.0
    container_name: grafana
    ports:
      - "3000:3000"
    environment:
      - GF_SECURITY_ADMIN_PASSWORD=admin
      - GF_USERS_ALLOW_SIGN_UP=false
    volumes:
      - grafana_data:/var/lib/grafana
      - ./grafana/provisioning:/etc/grafana/provisioning
      - ./grafana/dashboards:/var/lib/grafana/dashboards
    depends_on:
      - prometheus
    restart: unless-stopped

  alertmanager:
    image: prom/alertmanager:v0.26.0
    container_name: alertmanager
    ports:
      - "9093:9093"
    volumes:
      - ./alertmanager/alertmanager.yml:/etc/alertmanager/alertmanager.yml
    restart: unless-stopped

  loki:
    image: grafana/loki:2.9.0
    container_name: loki
    ports:
      - "3100:3100"
    volumes:
      - ./loki/loki-config.yml:/etc/loki/local-config.yaml
      - loki_data:/loki
    command: -config.file=/etc/loki/local-config.yaml
    restart: unless-stopped

  promtail:
    image: grafana/promtail:2.9.0
    container_name: promtail
    volumes:
      - ./promtail/promtail-config.yml:/etc/promtail/config.yml
      - /var/log:/var/log:ro
      - /var/lib/docker/containers:/var/lib/docker/containers:ro
    command: -config.file=/etc/promtail/config.yml
    restart: unless-stopped

  node-exporter:
    image: prom/node-exporter:v1.6.1
    container_name: node-exporter
    ports:
      - "9100:9100"
    volumes:
      - /proc:/host/proc:ro
      - /sys:/host/sys:ro
      - /:/rootfs:ro
    command:
      - '--path.procfs=/host/proc'
      - '--path.sysfs=/host/sys'
      - '--collector.filesystem.mount-points-exclude=^/(sys|proc|dev|host|etc)($$|/)'
    restart: unless-stopped

volumes:
  prometheus_data:
  grafana_data:
  loki_data:
Grafana Dashboard JSON
// grafana/dashboards/microservices-overview.json
{
  "dashboard": {
    "title": "Microservices Overview",
    "panels": [
      {
        "title": "Request Rate by Service",
        "type": "timeseries",
        "targets": [
          {
            "expr": "sum(rate(http_requests_total[5m])) by (service)",
            "legendFormat": "{{ service }}"
          }
        ],
        "gridPos": { "x": 0, "y": 0, "w": 12, "h": 8 }
      },
      {
        "title": "Error Rate by Service",
        "type": "timeseries",
        "targets": [
          {
            "expr": "sum(rate(http_requests_total{status_code=~'5..'}[5m])) by (service) / sum(rate(http_requests_total[5m])) by (service) * 100",
            "legendFormat": "{{ service }}"
          }
        ],
        "fieldConfig": {
          "defaults": {
            "unit": "percent",
            "thresholds": {
              "mode": "absolute",
              "steps": [
                { "value": 0, "color": "green" },
                { "value": 1, "color": "yellow" },
                { "value": 5, "color": "red" }
              ]
            }
          }
        },
        "gridPos": { "x": 12, "y": 0, "w": 12, "h": 8 }
      },
      {
        "title": "P95 Latency by Service",
        "type": "timeseries",
        "targets": [
          {
            "expr": "histogram_quantile(0.95, sum(rate(http_request_duration_seconds_bucket[5m])) by (le, service))",
            "legendFormat": "{{ service }}"
          }
        ],
        "fieldConfig": {
          "defaults": { "unit": "s" }
        },
        "gridPos": { "x": 0, "y": 8, "w": 12, "h": 8 }
      },
      {
        "title": "Service Health",
        "type": "stat",
        "targets": [
          {
            "expr": "up",
            "legendFormat": "{{ job }}"
          }
        ],
        "options": {
          "colorMode": "background",
          "graphMode": "none"
        },
        "gridPos": { "x": 12, "y": 8, "w": 12, "h": 8 }
      }
    ]
  }
}
Essential PromQL Queries
# Request rate per second
sum(rate(http_requests_total[5m])) by (service)

# Error rate percentage
sum(rate(http_requests_total{status_code=~"5.."}[5m])) by (service)
/
sum(rate(http_requests_total[5m])) by (service)
* 100

# P50, P95, P99 latency
histogram_quantile(0.50, sum(rate(http_request_duration_seconds_bucket[5m])) by (le))
histogram_quantile(0.95, sum(rate(http_request_duration_seconds_bucket[5m])) by (le))
histogram_quantile(0.99, sum(rate(http_request_duration_seconds_bucket[5m])) by (le))

# Requests per endpoint
sum(rate(http_requests_total[5m])) by (method, route)

# Memory usage in MB
process_resident_memory_bytes / 1024 / 1024

# CPU usage percentage
rate(process_cpu_seconds_total[5m]) * 100

# Increase in errors over last hour
increase(http_requests_total{status_code=~"5.."}[1h])

# Top 5 slowest endpoints
topk(5, histogram_quantile(0.95, sum(rate(http_request_duration_seconds_bucket[5m])) by (le, route)))
Logging with Loki
# loki/loki-config.yml
auth_enabled: false

server:
  http_listen_port: 3100

ingester:
  lifecycler:
    ring:
      kvstore:
        store: inmemory
      replication_factor: 1
  chunk_idle_period: 5m
  chunk_retain_period: 30s

schema_config:
  configs:
    - from: 2020-01-01
      store: boltdb-shipper
      object_store: filesystem
      schema: v11
      index:
        prefix: index_
        period: 24h

storage_config:
  boltdb_shipper:
    active_index_directory: /loki/index
    cache_location: /loki/cache
    shared_store: filesystem
  filesystem:
    directory: /loki/chunks

limits_config:
  enforce_metric_name: false
  reject_old_samples: true
  reject_old_samples_max_age: 168h
# promtail/promtail-config.yml
server:
http_listen_port: 9080
positions:
filename: /tmp/positions.yaml
clients:
- url: http://loki:3100/loki/api/v1/push
scrape_configs:
- job_name: containers
static_configs:
- targets:
- localhost
labels:
job: containerlogs
__path__: /var/lib/docker/containers/*/*log
pipeline_stages:
- json:
expressions:
output: log
stream: stream
timestamp: time
- labels:
stream:
- timestamp:
source: timestamp
format: RFC3339Nano
- output:
source: outputStructured Logging Best Practices
// logger.js - Structured JSON logging
const winston = require('winston');

const logger = winston.createLogger({
  level: process.env.LOG_LEVEL || 'info',
  format: winston.format.combine(
    winston.format.timestamp(),
    winston.format.errors({ stack: true }),
    winston.format.json()
  ),
  defaultMeta: {
    service: process.env.SERVICE_NAME || 'unknown',
    version: process.env.APP_VERSION || '1.0.0',
    environment: process.env.NODE_ENV || 'development'
  },
  transports: [
    new winston.transports.Console()
  ]
});

// Usage with context
function logRequest(req, res, duration) {
  logger.info('HTTP request completed', {
    method: req.method,
    path: req.path,
    statusCode: res.statusCode,
    duration,
    requestId: req.headers['x-request-id'],
    userId: req.user?.id
  });
}

// Error logging with stack trace
function logError(error, context = {}) {
  logger.error('Error occurred', {
    message: error.message,
    stack: error.stack,
    ...context
  });
}

module.exports = { logger, logRequest, logError };
Common Mistakes to Avoid
1. High Cardinality Labels
# BAD: User ID as label creates millions of time series
http_requests_total{user_id="12345"}

# GOOD: Use bounded labels
http_requests_total{user_type="premium"}
2. Missing Rate() for Counters
# BAD: Raw counter value is meaningless
http_requests_total

# GOOD: Use rate() to get per-second rate
rate(http_requests_total[5m])
3. Alerting on Instantaneous Values
# BAD: Single spike triggers alert
alert: HighLatency
expr: http_request_duration_seconds > 1

# GOOD: Use 'for' duration and aggregation
alert: HighLatency
expr: histogram_quantile(0.95, rate(http_request_duration_seconds_bucket[5m])) > 1
for: 5m
4. Not Monitoring the Monitoring System
# Always monitor Prometheus itself
- alert: PrometheusDown
  expr: up{job="prometheus"} == 0
  for: 1m
  labels:
    severity: critical
5. Logging Sensitive Data
// BAD: Logging sensitive information
logger.info('User login', { password: req.body.password });

// GOOD: Redact sensitive fields
logger.info('User login', { username: req.body.username, ip: req.ip });
Best Practices Summary
- Use labels wisely — low cardinality labels for filtering, avoid unique IDs.
- Build Grafana dashboards per service plus one global “health overview.”
- Alert on trends and percentiles, not single spikes or averages.
- Store metrics long-term using Thanos, Cortex, or Mimir.
- Correlate metrics with logs using common labels (request ID, trace ID).
- Use structured JSON logs with consistent field names across services.
- Set retention policies appropriate for your compliance needs.
- Monitor your monitoring stack — Prometheus, Alertmanager, Grafana all need health checks.
Final Thoughts
Prometheus and Grafana make it possible to observe complex microservice systems effectively. Prometheus collects metrics with its powerful pull model and PromQL query language, while Grafana transforms raw data into actionable dashboards and alerts. Adding Loki for log aggregation completes the observability picture.
Start small: instrument one service with basic metrics, then expand. Add logging correlation next to connect metrics with real events. As your system grows, invest in distributed tracing with Jaeger or Zipkin for complete request visibility.
To learn how monitoring fits into resilient architectures, check out Circuit Breakers & Resilience Patterns in Microservices. For deploying your monitoring stack on Kubernetes, see Kubernetes 101: Deploying and Managing Containerised Apps. For deeper technical guidance, visit the Prometheus documentation and Grafana documentation.


2 Comments