As PostgreSQL databases grow, performance problems rarely appear overnight. Instead, queries that once felt instant slowly become inconsistent and harder to reason about. PostgreSQL performance tuning is the discipline of understanding why queries slow down and aligning indexes, query structure, and execution plans with real usage patterns.
This article is written for developers already running PostgreSQL in production who want predictable performance. You will learn how indexes really work, how to read EXPLAIN output without guessing, and how to optimize queries based on measurable evidence.
Why PostgreSQL Performance Tuning Becomes Necessary
PostgreSQL ships with sensible defaults, but those defaults target general workloads. As data volume increases, inefficiencies in query structure start to dominate execution time. At that point, tuning PostgreSQL is no longer optional.
Many performance issues attributed to PostgreSQL are actually rooted in SQL design. Filtering order, join strategy, and data access patterns matter long before database-specific tweaks. At the application level, excessive request frequency can also hide or amplify database problems, which is why techniques discussed in debouncing, throttling, and performance optimisations often become relevant when database load increases unexpectedly.
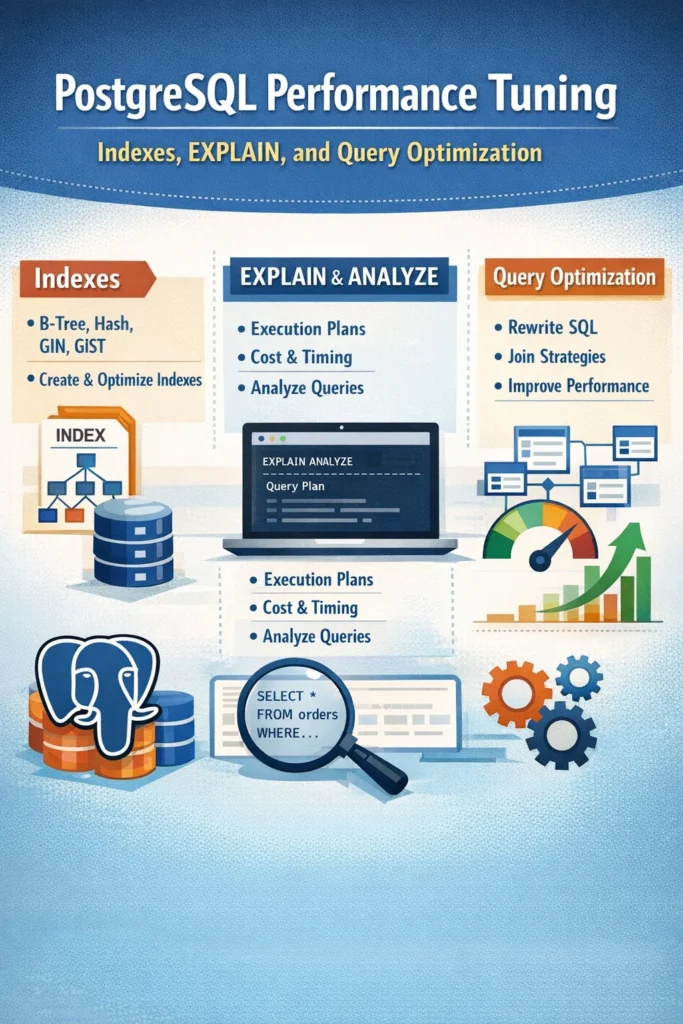
How Indexes Influence PostgreSQL Performance
Indexes are the most powerful lever in PostgreSQL performance tuning, but only when they reflect real query behavior.
An index allows PostgreSQL to avoid scanning the entire table. However, the planner will only use an index if it estimates that doing so is cheaper than a sequential scan. That estimate depends on table size, data distribution, and how the query is written.
Choosing the Right Index Type
PostgreSQL supports multiple index types, each optimized for specific access patterns.
B-tree indexes are the default and handle equality checks, range filters, ordering, and joins efficiently. Most transactional queries should rely on B-tree indexes.
GIN indexes are essential for JSONB columns, arrays, and full-text search. Without them, filtering inside structured data almost always results in sequential scans.
GiST indexes support more complex data types and flexible search strategies, but they are rarely the best choice for simple lookups.
The official PostgreSQL documentation provides a detailed breakdown of index types and trade-offs, which is useful when designing indexes for real workloads.
Composite and Partial Indexes in Practice
Composite indexes can dramatically improve performance when queries filter on multiple columns. However, column order matters. PostgreSQL uses composite indexes from left to right, so index design must mirror the most selective conditions in your queries.
Partial indexes are even more impactful in real systems. When a table contains a large number of rows but queries consistently target a specific subset, indexing only that subset reduces index size and improves selectivity.
This pattern appears frequently in backend systems using relational databases, including those demonstrated in Spring Boot PostgreSQL examples, where query performance depends heavily on correctly scoped indexes.
Understanding EXPLAIN and EXPLAIN ANALYZE
Indexes alone do not guarantee good performance. You must confirm how PostgreSQL actually executes your queries.
EXPLAIN shows PostgreSQL’s estimated execution plan, while EXPLAIN ANALYZE runs the query and reports real execution time and row counts. For PostgreSQL performance tuning, EXPLAIN ANALYZE is almost always required because estimates can drift as data grows or distributions change.
PostgreSQL’s documentation on using EXPLAIN explains how to interpret execution plans and why estimated costs may differ from actual execution.
Reading Execution Plans Correctly
Execution plans are read from the bottom up. Start with the deepest node and work upward. Sequential scans on large tables, nested loops with high iteration counts, and expensive sort steps are all signals that optimization is needed.
A common mistake is focusing exclusively on cost values. Cost is an internal planning metric, not a time measurement. PostgreSQL performance tuning should prioritize actual execution time reported by EXPLAIN ANALYZE.
When it is unclear whether PostgreSQL is the true bottleneck, combining query analysis with system-level visibility can help. Techniques covered in profiling CPU and memory usage in backend applications are particularly useful for separating database issues from infrastructure constraints.
Query Optimization Patterns That Matter
Once execution plans are understood, query optimization becomes methodical rather than experimental.
Avoid selecting unnecessary columns, especially in frequently executed queries. Narrow result sets reduce I/O and enable index-only scans, which can significantly improve performance.
Be careful when applying functions to indexed columns in WHERE clauses. Wrapping indexed columns in functions usually prevents index usage. Instead, rewrite conditions to preserve raw comparisons.
OR conditions frequently force PostgreSQL into sequential scans. In many cases, rewriting such queries as UNION ALL statements allows PostgreSQL to use indexes independently and produce faster results.
These problems often surface alongside application-layer inefficiencies, so database tuning should be evaluated together with request patterns and API design.
A Realistic PostgreSQL Performance Tuning Scenario
Consider a mid-sized production system with several million rows in an orders table. A dashboard query filters by status and sorts by creation date. Initially, performance is acceptable, but response times gradually become unpredictable.
EXPLAIN ANALYZE reveals a sequential scan despite existing indexes. The issue is that the index does not match the query’s filter and sort pattern. By introducing a partial index that targets the relevant status and supports ordering, PostgreSQL switches to an index scan and execution time stabilizes.
This kind of improvement is typical when PostgreSQL performance tuning focuses on real execution behavior instead of assumptions.
PostgreSQL Performance and Application Architecture
Performance tuning does not exist in isolation. Query efficiency, ORM behavior, and application architecture are tightly coupled. In systems using ORMs such as SQLAlchemy, query generation patterns can either help or hinder PostgreSQL’s planner.
Best practices for aligning ORM usage with PostgreSQL behavior are discussed in SQLAlchemy best practices with PostgreSQL, where query structure directly influences execution plans.
When to Apply PostgreSQL Performance Tuning
- Queries slow down as data volume increases
- EXPLAIN shows sequential scans on large tables
- Database CPU or I/O usage spikes under normal load
- Latency-sensitive endpoints depend on complex queries
When NOT to Over-Optimize
- Tables are small and unlikely to grow
- Queries run infrequently
- Bottlenecks exist outside the database
- Optimizations add unnecessary schema complexity
Common PostgreSQL Performance Tuning Mistakes
- Adding indexes without validating EXPLAIN output
- Ignoring outdated statistics and index bloat
- Trusting estimated costs over real execution time
- Optimizing queries that are not performance-critical
Conclusion
PostgreSQL performance tuning is about alignment. When indexes, queries, and execution plans reflect real usage patterns, PostgreSQL delivers consistent and predictable performance. Start with EXPLAIN ANALYZE, validate index usage, and optimize only what matters.
For deeper exploration, PostgreSQL’s performance optimization guide consolidates advanced techniques worth reviewing as systems scale. The most effective next step, however, is practical: take one slow query from production and analyze its execution plan line by line.

7 Comments