Introduction
As applications grow in complexity and scale, understanding where performance bottlenecks occur becomes essential for maintaining responsive, efficient systems. High CPU usage, memory leaks, inefficient algorithms, and slow database queries can transform a smooth-running application into an unreliable bottleneck. Profiling provides the data-driven insights needed to identify exactly where time and resources are being consumed, enabling targeted optimizations rather than educated guesses.
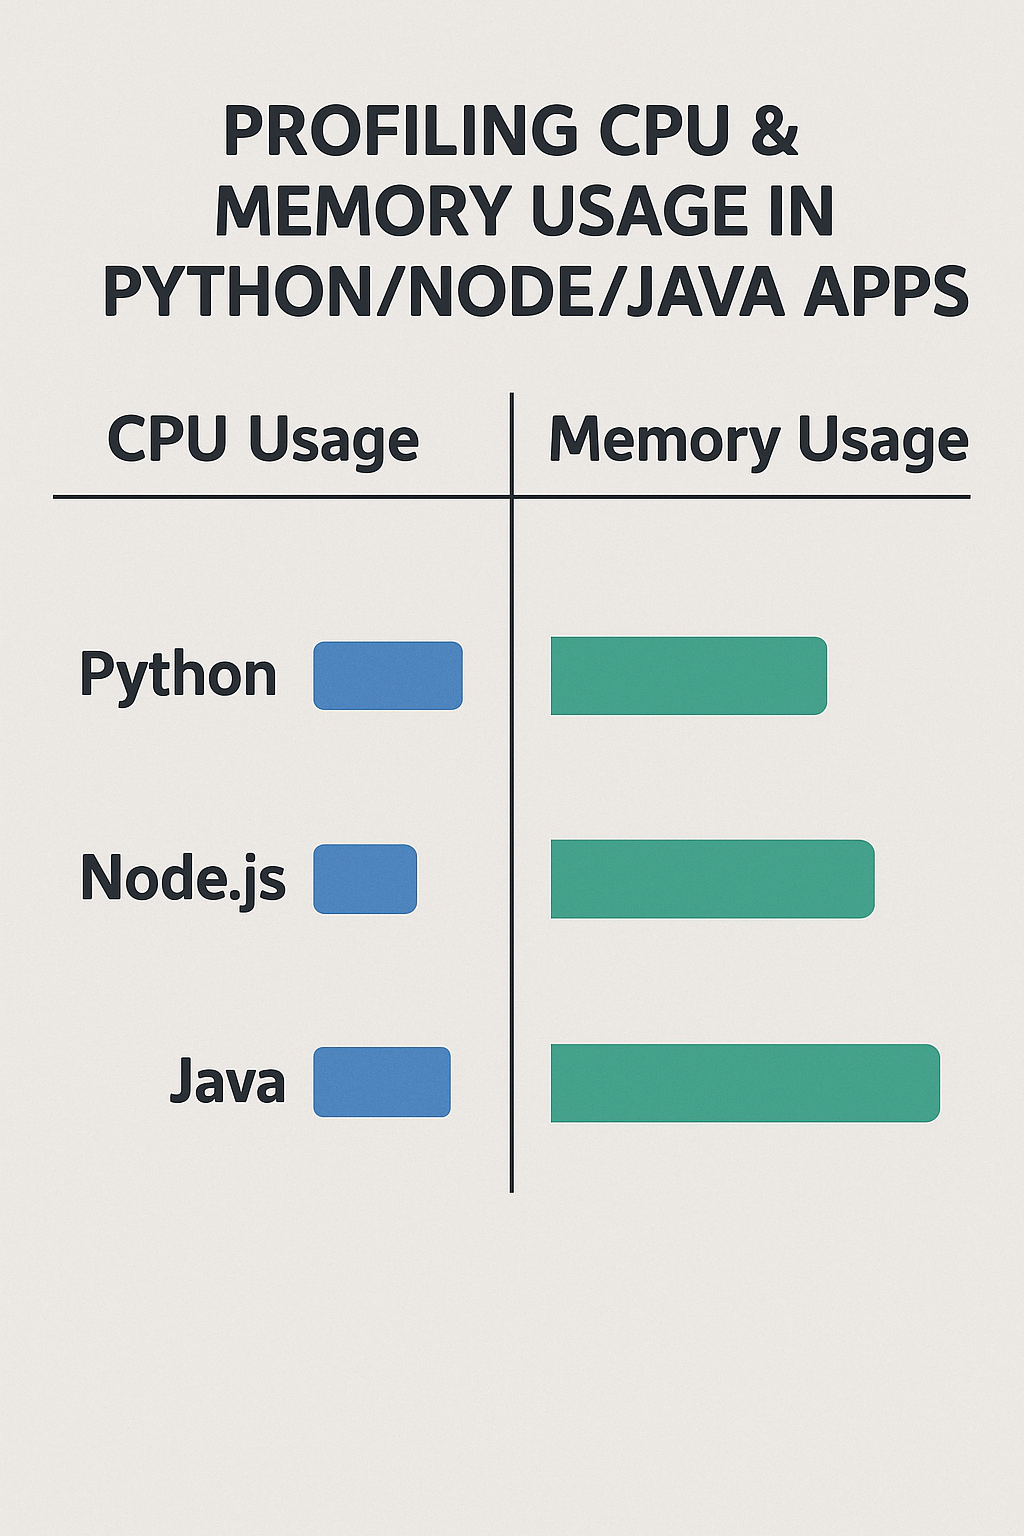
In this comprehensive guide, you’ll learn how to profile CPU and memory usage in Python, Node.js, and Java applications using both built-in tools and professional-grade profilers. We’ll cover practical examples, visualization techniques, and production-ready profiling strategies.
Why Profiling Matters
Profiling reveals exactly where your application spends time and allocates memory, enabling precise optimization of actual bottlenecks rather than suspected ones.
Key Benefits of Profiling
- Detect memory leaks: Find objects that accumulate over time and never get garbage collected.
- Identify hot functions: Discover which functions consume the most CPU time.
- Analyze GC patterns: Understand garbage collection frequency and duration.
- Improve latency: Reduce response times by optimizing critical paths.
- Ensure scalability: Validate performance under increasing load.
- Reduce costs: Lower cloud infrastructure expenses through efficient resource usage.
Types of Profiling
- CPU Profiling: Measures execution time across functions and call stacks.
- Memory Profiling: Tracks heap allocations, object counts, and memory growth.
- I/O Profiling: Monitors file system, network, and database operations.
- Concurrency Profiling: Analyzes thread contention, locks, and async operations.
Profiling in Python
Python offers several built-in and third-party profiling tools, from simple timing to comprehensive flame graphs.
CPU Profiling with cProfile
cProfile is Python’s built-in deterministic profiler that records every function call.
# profiling_demo.py - Basic cProfile Usage
import cProfile
import pstats
import io
from functools import wraps

def profile_function(func):
    """Decorator to profile individual functions."""
    @wraps(func)
    def wrapper(*args, **kwargs):
        profiler = cProfile.Profile()
        profiler.enable()

        result = func(*args, **kwargs)

        profiler.disable()

        # Print sorted statistics
        stream = io.StringIO()
        stats = pstats.Stats(profiler, stream=stream)
        stats.sort_stats('cumulative')
        stats.print_stats(20)  # Top 20 functions
        print(stream.getvalue())

        return result
    return wrapper


@profile_function
def expensive_computation():
    """Simulate CPU-intensive work."""
    result = []
    for i in range(10000):
        result.append(sum(j ** 2 for j in range(100)))
    return result


# Run profiling from command line
# python -m cProfile -o output.prof -s cumulative app.py
Line-by-Line Profiling with line_profiler
# Install: pip install line_profiler

# Use @profile decorator (provided by kernprof)
@profile
def process_data(data):
    """Process data with line-by-line timing."""
    # Line 1: O(n) operation
    filtered = [x for x in data if x > 0]

    # Line 2: O(n log n) operation
    sorted_data = sorted(filtered)

    # Line 3: O(n) operation
    normalized = [x / max(sorted_data) for x in sorted_data]

    return normalized

# Run with: kernprof -l -v script.py
# Output shows time spent on each line:
# Example output from line_profiler
Line # Hits Time Per Hit % Time Line Contents
==============================================================
4 1000 15234.0 15.2 12.3 filtered = [x for x in data if x > 0]
7 1000 89432.0 89.4 72.1 sorted_data = sorted(filtered)
10 1000 19321.0 19.3 15.6 normalized = [x / max(sorted_data) for x in sorted_data]Memory Profiling with tracemalloc
# memory_profiling.py - Track Memory Allocations
import tracemalloc
import linecache
from typing import List, Tuple

def display_top_allocations(snapshot, limit: int = 10) -> None:
    """Display top memory allocations with source locations."""
    top_stats = snapshot.statistics('lineno')

    print(f"\nTop {limit} memory allocations:")
    print("=" * 60)

    for index, stat in enumerate(top_stats[:limit], 1):
        frame = stat.traceback[0]
        filename = frame.filename
        lineno = frame.lineno

        print(f"#{index}: {filename}:{lineno}")
        print(f"    Size: {stat.size / 1024:.2f} KB")
        print(f"    Count: {stat.count} allocations")

        # Show the actual line of code
        line = linecache.getline(filename, lineno).strip()
        if line:
            print(f"    Code: {line}")
        print()


def compare_snapshots(
    snapshot1: tracemalloc.Snapshot,
    snapshot2: tracemalloc.Snapshot
) -> List[Tuple[str, int]]:
    """Compare two snapshots to find memory growth."""
    top_stats = snapshot2.compare_to(snapshot1, 'lineno')

    growth = []
    for stat in top_stats[:10]:
        if stat.size_diff > 0:
            growth.append((str(stat), stat.size_diff))

    return growth


# Practical usage example
def analyze_memory_leak():
    """Demonstrate memory leak detection."""
    tracemalloc.start()

    # Take initial snapshot
    snapshot1 = tracemalloc.take_snapshot()

    # Run potentially leaky code
    cache = {}
    for i in range(10000):
        # Simulated leak: growing cache without bounds
        cache[f"key_{i}"] = f"value_{i}" * 100

    # Take second snapshot
    snapshot2 = tracemalloc.take_snapshot()

    # Compare to find growth
    print("Memory growth between snapshots:")
    for stat, diff in compare_snapshots(snapshot1, snapshot2):
        print(f"  {stat}: +{diff / 1024:.2f} KB")

    display_top_allocations(snapshot2)

    current, peak = tracemalloc.get_traced_memory()
    print(f"\nCurrent memory: {current / 1024 / 1024:.2f} MB")
    print(f"Peak memory: {peak / 1024 / 1024:.2f} MB")

    tracemalloc.stop()


if __name__ == "__main__":
    analyze_memory_leak()
Scalene: CPU, Memory, and GPU Profiler
# Install Scalene
pip install scalene

# Run with detailed output
scalene --cpu --memory --gpu script.py

# Generate HTML report
scalene --html --outfile profile.html script.py

# Profile specific function
scalene --profile-only "module_name.function_name" script.py
# scalene_example.py - Code optimized based on Scalene output
import numpy as np
from scalene import scalene_profiler
# Scalene shows this is slow due to Python loops
def slow_matrix_multiply(a, b):
"""Pure Python matrix multiplication - CPU intensive."""
result = [[0] * len(b[0]) for _ in range(len(a))]
for i in range(len(a)):
for j in range(len(b[0])):
for k in range(len(b)):
result[i][j] += a[i][k] * b[k][j]
return result
# Scalene reveals this is 100x faster
def fast_matrix_multiply(a, b):
"""NumPy matrix multiplication - uses optimized C code."""
return np.dot(a, b)
# Programmatic profiling
with scalene_profiler.profile():
# Only this block is profiled
result = fast_matrix_multiply(
np.random.rand(100, 100),
np.random.rand(100, 100)
)Py-Spy: Low-Overhead Sampling Profiler
# Install py-spy
pip install py-spy

# Profile a running process (no code changes needed)
py-spy top --pid 12345

# Record to flame graph
py-spy record -o profile.svg --pid 12345

# Profile a script
py-spy record -o profile.svg -- python app.py

# Dump current stack traces
py-spy dump --pid 12345
Profiling in Node.js
Node.js leverages V8’s powerful profiling capabilities along with excellent third-party tools.
Built-in V8 Profiler
// profiler.js - Programmatic CPU Profiling
const v8Profiler = require('v8-profiler-next');
const fs = require('fs');

class ProfilerUtil {
  constructor() {
    this.profileId = 0;
  }

  startCpuProfile(name = 'cpu-profile') {
    const title = `${name}-${++this.profileId}`;
    v8Profiler.startProfiling(title, true);
    return title;
  }

  stopCpuProfile(title, outputPath = './profiles') {
    const profile = v8Profiler.stopProfiling(title);

    return new Promise((resolve, reject) => {
      profile.export((error, result) => {
        if (error) {
          reject(error);
          return;
        }

        const filename = `${outputPath}/${title}-${Date.now()}.cpuprofile`;
        fs.writeFileSync(filename, result);
        profile.delete();

        console.log(`CPU profile saved to: ${filename}`);
        resolve(filename);
      });
    });
  }

  takeHeapSnapshot(outputPath = './profiles') {
    const snapshot = v8Profiler.takeSnapshot();
    const filename = `${outputPath}/heap-${Date.now()}.heapsnapshot`;

    return new Promise((resolve, reject) => {
      snapshot.export((error, result) => {
        if (error) {
          reject(error);
          return;
        }

        fs.writeFileSync(filename, result);
        snapshot.delete();

        console.log(`Heap snapshot saved to: ${filename}`);
        resolve(filename);
      });
    });
  }
}

// Usage in Express app
const express = require('express');
const app = express();
const profiler = new ProfilerUtil();

// Endpoint to trigger profiling
app.post('/debug/profile/start', (req, res) => {
  const title = profiler.startCpuProfile('api-profile');
  res.json({ message: 'Profiling started', title });
});

app.post('/debug/profile/stop', async (req, res) => {
  const { title } = req.body;
  const filename = await profiler.stopCpuProfile(title);
  res.json({ message: 'Profiling stopped', filename });
});

app.post('/debug/heap-snapshot', async (req, res) => {
  const filename = await profiler.takeHeapSnapshot();
  res.json({ message: 'Heap snapshot taken', filename });
});
Clinic.js: Visual Performance Analysis
# Install Clinic.js suite
npm install -g clinic

# Doctor: Detect common performance issues
clinic doctor -- node app.js

# Flame: Generate flame graphs
clinic flame -- node app.js

# Bubbleprof: Async operation analysis
clinic bubbleprof -- node app.js

# Heapprofiler: Memory analysis
clinic heapprofiler -- node app.js
Memory Leak Detection
// memory-leak-detector.js - Detect Memory Leaks
const v8 = require('v8');

class MemoryMonitor {
  constructor(options = {}) {
    this.thresholdMB = options.thresholdMB || 100;
    this.checkIntervalMs = options.checkIntervalMs || 30000;
    this.samples = [];
    this.maxSamples = options.maxSamples || 100;
  }

  getHeapStats() {
    const stats = v8.getHeapStatistics();
    return {
      timestamp: Date.now(),
      usedHeapMB: Math.round(stats.used_heap_size / 1024 / 1024),
      totalHeapMB: Math.round(stats.total_heap_size / 1024 / 1024),
      heapLimitMB: Math.round(stats.heap_size_limit / 1024 / 1024),
      externalMB: Math.round(stats.external_memory / 1024 / 1024)
    };
  }

  recordSample() {
    const stats = this.getHeapStats();
    this.samples.push(stats);

    if (this.samples.length > this.maxSamples) {
      this.samples.shift();
    }

    return stats;
  }

  detectLeak() {
    if (this.samples.length < 10) {
      return { detected: false, message: 'Not enough samples' };
    }

    const recentSamples = this.samples.slice(-10);
    const oldSamples = this.samples.slice(0, 10);

    const recentAvg = recentSamples.reduce((sum, s) => sum + s.usedHeapMB, 0) / 10;
    const oldAvg = oldSamples.reduce((sum, s) => sum + s.usedHeapMB, 0) / 10;

    const growth = recentAvg - oldAvg;
    const growthPercent = (growth / oldAvg) * 100;

    if (growth > this.thresholdMB) {
      return {
        detected: true,
        message: `Memory grew by ${growth.toFixed(2)} MB (${growthPercent.toFixed(1)}%)`,
        oldAvgMB: oldAvg,
        recentAvgMB: recentAvg
      };
    }

    return { detected: false, growthMB: growth };
  }

  startMonitoring(callback) {
    this.interval = setInterval(() => {
      const stats = this.recordSample();
      const leakCheck = this.detectLeak();

      if (callback) {
        callback(stats, leakCheck);
      }

      if (leakCheck.detected) {
        console.warn('[Memory Warning]', leakCheck.message);
      }
    }, this.checkIntervalMs);
  }

  stopMonitoring() {
    if (this.interval) {
      clearInterval(this.interval);
    }
  }
}

// Usage
const monitor = new MemoryMonitor({ thresholdMB: 50 });

monitor.startMonitoring((stats, leak) => {
  console.log(`Heap: ${stats.usedHeapMB}MB / ${stats.totalHeapMB}MB`);
  if (leak.detected) {
    // Trigger heap snapshot or alert
    console.error('Potential memory leak detected!');
  }
});
Async Hooks for Operation Tracking
// async-profiler.js - Track Async Operations
const async_hooks = require('async_hooks');
const fs = require('fs');

class AsyncProfiler {
  constructor() {
    this.operations = new Map();
    this.stats = {
      totalOperations: 0,
      activeOperations: 0,
      byType: {}
    };
  }

  enable() {
    const hook = async_hooks.createHook({
      init: (asyncId, type, triggerAsyncId) => {
        this.operations.set(asyncId, {
          type,
          triggerAsyncId,
          startTime: process.hrtime.bigint(),
          state: 'init'
        });

        this.stats.totalOperations++;
        this.stats.activeOperations++;
        this.stats.byType[type] = (this.stats.byType[type] || 0) + 1;
      },

      before: (asyncId) => {
        const op = this.operations.get(asyncId);
        if (op) {
          op.state = 'executing';
          op.beforeTime = process.hrtime.bigint();
        }
      },

      after: (asyncId) => {
        const op = this.operations.get(asyncId);
        if (op) {
          op.state = 'completed';
          op.afterTime = process.hrtime.bigint();
          op.executionTimeMs = Number(op.afterTime - op.beforeTime) / 1e6;
        }
      },

      destroy: (asyncId) => {
        const op = this.operations.get(asyncId);
        if (op) {
          op.endTime = process.hrtime.bigint();
          op.totalTimeMs = Number(op.endTime - op.startTime) / 1e6;
          this.stats.activeOperations--;

          // Keep only slow operations
          if (op.totalTimeMs < 10) {
            this.operations.delete(asyncId);
          }
        }
      }
    });

    hook.enable();
    return hook;
  }

  getSlowOperations(thresholdMs = 100) {
    const slow = [];
    for (const [id, op] of this.operations) {
      if (op.totalTimeMs && op.totalTimeMs > thresholdMs) {
        slow.push({ asyncId: id, ...op });
      }
    }
    return slow.sort((a, b) => b.totalTimeMs - a.totalTimeMs);
  }

  getStats() {
    return {
      ...this.stats,
      slowOperations: this.getSlowOperations()
    };
  }
}

// Usage
const profiler = new AsyncProfiler();
const hook = profiler.enable();

// Check stats periodically
setInterval(() => {
  console.log('Async Stats:', profiler.getStats());
}, 5000);
Profiling in Java
The JVM ecosystem provides the most advanced profiling capabilities with production-ready tools.
Java Flight Recorder (JFR)
# Start JFR recording from command line
java -XX:StartFlightRecording=duration=60s,filename=recording.jfr -jar app.jar

# Continuous recording with max size
java -XX:StartFlightRecording=maxsize=500m,maxage=1h,filename=continuous.jfr -jar app.jar

# Control recording via jcmd
jcmd <pid> JFR.start name=profile duration=120s filename=profile.jfr
jcmd <pid> JFR.check
jcmd <pid> JFR.stop name=profile
jcmd <pid> JFR.dump name=profile filename=dump.jfr
// JfrProfiler.java - Programmatic JFR Control
import jdk.jfr.*;
import jdk.jfr.consumer.*;
import java.nio.file.Path;
import java.time.Duration;
import java.util.*;
public class JfrProfiler {
private Recording recording;
public void startRecording(String name) {
recording = new Recording();
recording.setName(name);
// Enable specific events
recording.enable("jdk.CPULoad")
.withPeriod(Duration.ofSeconds(1));
recording.enable("jdk.GCHeapSummary");
recording.enable("jdk.ObjectAllocationOutsideTLAB")
.withThreshold(Duration.ofMillis(1));
recording.enable("jdk.JavaMonitorEnter")
.withThreshold(Duration.ofMillis(10));
recording.enable("jdk.ThreadSleep");
recording.enable("jdk.FileRead")
.withThreshold(Duration.ofMillis(1));
recording.enable("jdk.SocketRead")
.withThreshold(Duration.ofMillis(1));
recording.start();
System.out.println("JFR recording started: " + name);
}
public Path stopRecording(Path outputPath) throws Exception {
recording.stop();
recording.dump(outputPath);
recording.close();
System.out.println("JFR recording saved to: " + outputPath);
return outputPath;
}
public static void analyzeRecording(Path jfrFile) throws Exception {
Map methodTimes = new HashMap<>();
Map allocationSizes = new HashMap<>();
List gcEvents = new ArrayList<>();
try (RecordingFile recordingFile = new RecordingFile(jfrFile)) {
while (recordingFile.hasMoreEvents()) {
RecordedEvent event = recordingFile.readEvent();
String eventType = event.getEventType().getName();
switch (eventType) {
case "jdk.ExecutionSample":
processExecutionSample(event, methodTimes);
break;
case "jdk.ObjectAllocationOutsideTLAB":
processAllocation(event, allocationSizes);
break;
case "jdk.GCHeapSummary":
gcEvents.add(new GCEvent(event));
break;
}
}
}
// Print analysis
System.out.println("\n=== Hot Methods ===");
methodTimes.entrySet().stream()
.sorted(Map.Entry.comparingByValue().reversed())
.limit(10)
.forEach(e -> System.out.printf("%s: %d samples%n", e.getKey(), e.getValue()));
System.out.println("\n=== Top Allocators ===");
allocationSizes.entrySet().stream()
.sorted(Map.Entry.comparingByValue().reversed())
.limit(10)
.forEach(e -> System.out.printf("%s: %d bytes%n", e.getKey(), e.getValue()));
}
private static void processExecutionSample(
RecordedEvent event,
Map methodTimes) {
RecordedStackTrace stackTrace = event.getStackTrace();
if (stackTrace != null && !stackTrace.getFrames().isEmpty()) {
RecordedFrame topFrame = stackTrace.getFrames().get(0);
String method = topFrame.getMethod().getType().getName() +
"." + topFrame.getMethod().getName();
methodTimes.merge(method, 1L, Long::sum);
}
}
private static void processAllocation(
RecordedEvent event,
Map allocationSizes) {
String className = event.getClass("objectClass").getName();
long size = event.getLong("allocationSize");
allocationSizes.merge(className, size, Long::sum);
}
static class GCEvent {
final long heapUsed;
final long heapCommitted;
final long timestamp;
GCEvent(RecordedEvent event) {
this.heapUsed = event.getLong("heapUsed");
this.heapCommitted = event.getLong("heapCommitted");
this.timestamp = event.getStartTime().toEpochMilli();
}
}
} Async-Profiler: Low-Overhead Sampling
# Download async-profiler
wget https://github.com/async-profiler/async-profiler/releases/download/v2.9/async-profiler-2.9-linux-x64.tar.gz

# Profile running JVM
./profiler.sh -d 30 -f profile.html <pid>

# Profile with flame graph output
./profiler.sh -d 60 -f flamegraph.svg <pid>

# Profile allocations
./profiler.sh -e alloc -d 30 -f alloc.svg <pid>

# Profile lock contention
./profiler.sh -e lock -d 30 -f locks.svg <pid>

# Wall-clock profiling (includes waiting time)
./profiler.sh -e wall -d 30 -f wall.svg <pid>

# As Java agent
java -agentpath:/path/to/libasyncProfiler.so=start,event=cpu,file=profile.svg -jar app.jar
Micrometer Metrics for Production
// MetricsConfig.java - Production Metrics Setup
import io.micrometer.core.instrument.*;
import io.micrometer.core.instrument.binder.jvm.*;
import io.micrometer.core.instrument.binder.system.*;
import io.micrometer.prometheus.PrometheusConfig;
import io.micrometer.prometheus.PrometheusMeterRegistry;
import org.springframework.context.annotation.Bean;
import org.springframework.context.annotation.Configuration;

@Configuration
public class MetricsConfig {

    @Bean
    public PrometheusMeterRegistry prometheusMeterRegistry() {
        PrometheusMeterRegistry registry = new PrometheusMeterRegistry(
            PrometheusConfig.DEFAULT
        );

        // JVM metrics
        new JvmMemoryMetrics().bindTo(registry);
        new JvmGcMetrics().bindTo(registry);
        new JvmThreadMetrics().bindTo(registry);
        new JvmHeapPressureMetrics().bindTo(registry);
        new JvmCompilationMetrics().bindTo(registry);

        // System metrics
        new ProcessorMetrics().bindTo(registry);
        new UptimeMetrics().bindTo(registry);
        new FileDescriptorMetrics().bindTo(registry);

        return registry;
    }
}

// PerformanceService.java - Custom Metrics
import io.micrometer.core.annotation.Timed;
import io.micrometer.core.instrument.*;
import org.springframework.stereotype.Service;

@Service
public class PerformanceService {

    private final MeterRegistry registry;
    private final Timer processTimer;
    private final Counter errorCounter;
    private final DistributionSummary responseSizes;

    public PerformanceService(MeterRegistry registry) {
        this.registry = registry;

        this.processTimer = Timer.builder("service.process.time")
            .description("Time spent processing requests")
            .publishPercentiles(0.5, 0.95, 0.99)
            .publishPercentileHistogram()
            .register(registry);

        this.errorCounter = Counter.builder("service.errors")
            .description("Number of processing errors")
            .register(registry);

        this.responseSizes = DistributionSummary.builder("service.response.size")
            .description("Response payload sizes")
            .baseUnit("bytes")
            .publishPercentiles(0.5, 0.95)
            .register(registry);
    }

    @Timed(value = "service.operation", percentiles = {0.5, 0.95, 0.99})
    public Result processRequest(Request request) {
        return processTimer.record(() -> {
            try {
                Result result = doProcess(request);
                responseSizes.record(result.getSize());
                return result;
            } catch (Exception e) {
                errorCounter.increment();
                throw e;
            }
        });
    }

    // Track active operations
    public void trackActiveOperations(String operationType, Runnable operation) {
        Gauge.builder("service.active.operations", () -> getActiveCount())
             .tag("type", operationType)
             .register(registry);

        operation.run();
    }
}
Heap Dump Analysis
# Generate heap dump
jcmd <pid> GC.heap_dump /tmp/heapdump.hprof

# Or using jmap
jmap -dump:format=b,file=/tmp/heapdump.hprof <pid>

# Analyze with Eclipse MAT (Memory Analyzer Tool)
./MemoryAnalyzer -vmargs -Xmx4g
# Open heapdump.hprof and run "Leak Suspects Report"

# Command-line analysis with jhat
jhat -J-Xmx4g /tmp/heapdump.hprof
# Access at http://localhost:7000
// HeapDumpUtil.java - Programmatic Heap Dumps
import com.sun.management.HotSpotDiagnosticMXBean;
import javax.management.MBeanServer;
import java.io.IOException;
import java.lang.management.ManagementFactory;
import java.nio.file.Path;
public class HeapDumpUtil {
private static final String HOTSPOT_BEAN =
"com.sun.management:type=HotSpotDiagnostic";
public static void dumpHeap(Path outputPath, boolean live) throws IOException {
MBeanServer server = ManagementFactory.getPlatformMBeanServer();
HotSpotDiagnosticMXBean bean = ManagementFactory.newPlatformMXBeanProxy(
server,
HOTSPOT_BEAN,
HotSpotDiagnosticMXBean.class
);
bean.dumpHeap(outputPath.toString(), live);
System.out.println("Heap dump written to: " + outputPath);
}
// Trigger heap dump on OutOfMemoryError
// JVM flag: -XX:+HeapDumpOnOutOfMemoryError -XX:HeapDumpPath=/var/log/heapdumps/
}Common Mistakes to Avoid
1. Profiling in Development Only
# WRONG - Only profile locally, ignore production behavior
def process_data(data):
    # Works fine with 100 items in dev
    return sorted([transform(x) for x in data])

# CORRECT - Use sampling profilers safe for production
import cProfile
import random

PROFILE_SAMPLE_RATE = 0.01  # Profile 1% of requests

def process_data_with_profiling(data):
    if random.random() < PROFILE_SAMPLE_RATE:
        profiler = cProfile.Profile()
        profiler.enable()
        result = _process_data(data)
        profiler.disable()
        send_profile_to_monitoring(profiler)
        return result
    return _process_data(data)
2. Ignoring Garbage Collection Impact
// WRONG - Creating excessive garbage
public String buildResponse(List<Item> items) {
    String result = "";
    for (Item item : items) {
        result += item.toString() + ",";  // Creates new String each iteration
    }
    return result;
}

// CORRECT - Minimize allocations
public String buildResponse(List<Item> items) {
    StringBuilder result = new StringBuilder(items.size() * 50);
    for (int i = 0; i < items.size(); i++) {
        if (i > 0) result.append(',');
        result.append(items.get(i).toString());
    }
    return result.toString();
}
3. Not Correlating CPU and Memory
// WRONG - Only checking CPU time
async function processLargeDataset(data) {
  console.time('processing');
  const results = data.map(item => transform(item));
  console.timeEnd('processing');  // Only measures time
  return results;
}

// CORRECT - Monitor both CPU and memory
async function processLargeDataset(data) {
  const startMemory = process.memoryUsage().heapUsed;
  const startTime = process.hrtime.bigint();

  // Process in chunks to manage memory
  const results = [];
  const chunkSize = 1000;

  for (let i = 0; i < data.length; i += chunkSize) {
    const chunk = data.slice(i, i + chunkSize);
    const chunkResults = chunk.map(item => transform(item));
    results.push(...chunkResults);

    // Allow GC between chunks
    if (i % 10000 === 0) {
      await new Promise(resolve => setImmediate(resolve));
    }
  }

  const endTime = process.hrtime.bigint();
  const endMemory = process.memoryUsage().heapUsed;

  console.log(`Time: ${Number(endTime - startTime) / 1e6}ms`);
  console.log(`Memory delta: ${(endMemory - startMemory) / 1024 / 1024}MB`);

  return results;
}
4. Missing I/O Bottlenecks
# WRONG - CPU profiler shows function is fast, but it's actually slow
def get_user_data(user_id):
    # CPU profiler misses database wait time
    return db.query(f"SELECT * FROM users WHERE id = {user_id}")

# CORRECT - Include I/O timing
import time
from functools import wraps

def profile_io(func):
    @wraps(func)
    def wrapper(*args, **kwargs):
        start = time.perf_counter()
        result = func(*args, **kwargs)
        elapsed = time.perf_counter() - start

        if elapsed > 0.1:  # Log slow I/O
            logger.warning(
                f"Slow I/O: {func.__name__} took {elapsed:.3f}s",
                extra={'args': args, 'elapsed': elapsed}
            )

        return result
    return wrapper

@profile_io
def get_user_data(user_id):
    return db.query("SELECT * FROM users WHERE id = %s", (user_id,))
Best Practices for Effective Profiling
- Establish baselines: Profile before optimizing to measure improvement accurately.
- Use sampling profilers in production: Deterministic profilers add too much overhead.
- Profile realistic workloads: Test with production-like data volumes and patterns.
- Combine CPU and memory analysis: Memory pressure causes CPU spikes through GC.
- Profile under load: Single-user performance differs from concurrent access.
- Automate profiling: Include performance tests in CI/CD pipelines.
- Monitor continuously: Use APM tools for ongoing production visibility.
- Document findings: Record bottlenecks and fixes to prevent regressions.
Final Thoughts
Profiling CPU and memory usage is essential for building fast, scalable applications. Each language ecosystem provides powerful tools: Python offers cProfile, tracemalloc, and Scalene for comprehensive analysis; Node.js leverages V8's profiling capabilities through DevTools and Clinic.js; Java provides JFR and async-profiler for production-grade insights. The key is using sampling profilers in production to identify real bottlenecks without impacting performance.
Once you identify bottlenecks through profiling, optimization becomes a precise, data-driven process rather than guesswork. For more on optimizing your development workflow, check out Using Docker for Local Development: Tips and Pitfalls and Integrating Redis Cache into Spring Applications. For official profiling documentation, explore the Node.js profiling guide and JDK Mission Control documentation.