Observability cost is the line item that surprises teams twice: once when the first real bill arrives, and again when someone finally reads the rate card and realizes the bill was correct all along. The reason is that the three main options do not bill the same thing. Datadog sells hosts and indexed log events, Grafana Cloud sells active metric series and written gigabytes, and a self-hosted stack sells you nothing at all, it just consumes instances and engineer hours. This post prices all three against list prices read on 23 September 2026, using three concrete workloads, and shows exactly where each option stops being the cheap one.
Here is the short version, before the tables. Grafana Cloud comes in between 40% and 46% of a comparable Datadog bill at every scale tested. Datadog logs only win when your average log line runs bigger than about 5 KB. Self-hosting, meanwhile, saves so little at small and mid scale that the saving is measured in single-digit engineer hours per month.
Where These 2026 Prices Came From
Any observability cost comparison is worthless without a date on it, so here is exactly what was read and when.
Prices read 2026-09-23, region us-east-1, public list price, USD
No volume, enterprise, startup-credit or private-pricing discount applied

Datadog        datadoghq.com/pricing, annual-commitment column
Grafana Cloud  grafana.com/pricing, Pro plan, pay-as-you-go rates
AWS EC2, EBS   AmazonEC2 offer file, publicationDate 2026-09-21T19:47:12Z
AWS S3         AmazonS3 offer file, publicationDate 2026-09-18T17:47:47Z

Next scheduled re-read: 2026-12-23
The AWS numbers come from the public offer files rather than the pricing pages, because those pages render their tables in JavaScript and frequently omit the Graviton tier. The offer files need no credentials:
# Every gp3 and instance rate AWS actually meters in us-east-1
curl -s https://pricing.us-east-1.amazonaws.com/offers/v1.0/aws/AmazonS3/current/us-east-1/index.json \
  | grep -o '"description" : "\$[^"]*"' | sort -u | head
Datadog and Grafana Cloud publish their list rates as HTML on the pages linked above. Both quote annual-commitment and on-demand columns; this post uses annual for Datadog and pay-as-you-go for Grafana Cloud Pro, which is the pairing most teams actually sign.
The Three Billing Models, Side by Side
Before any arithmetic, it helps to see what each vendor is selling. The billing unit drives every conclusion below.
| Datadog | Grafana Cloud Pro | Self-host (Prometheus, Loki, Grafana) | |
|---|---|---|---|
| Metrics billed by | Host, per month | Active series, per 1k | Instance hours and disk |
| Logs billed by | Indexed events, per million | Gigabytes written | Instance hours and disk |
| Scales to zero | No | Effectively yes on usage | No |
| Cost of an idle month | Full per-host price | Platform fee plus retained data | Full instance price |
| Included metric retention | 15 months | 13 months | However long you pay for disk |
| Included log retention | 15 days at the listed rate | 30 days | However long you pay for disk |
| Who runs the upgrade | Datadog | Grafana Labs | You |
| Public rate card for every line | No, some lines are contract-only | Yes | Not applicable |
That second-to-last row is the one every build-versus-buy argument eventually lands on, and the final section puts a number on it.
Datadog’s Rate Card, Read on 23 September 2026
Datadog’s model is per host, with allotments attached to each host and metered overage beyond them. All rates below are the annual-commitment column from the Datadog pricing page.
| Line item | Annual rate | On-demand rate | Included allotment |
|---|---|---|---|
| Infrastructure Pro | $15 per host, per month | $18 | 100 custom metrics and 5 containers per host |
| Infrastructure Enterprise | $23 per host, per month | $27 | 200 custom metrics and 10 containers per host |
| Additional containers | $1 per container, per month | $0.002 per container-hour | None |
| Log ingestion | $0.10 per ingested or scanned GB | Same | None |
| Log indexing, 15-day retention | $1.70 per million log events | $2.55 | None |
| Flex Logs storage | $0.05 per million events stored | $0.075 | 1 to 15 months retention |
| Flex Logs Starter | $0.60 per million events stored | $0.90 | 3 to 15 months retention |
| APM | $31 per host, per month | $48 | Bundled with Infrastructure |
| APM Pro | $35 per host, per month | $54 | Bundled with Infrastructure |
| Log forwarding to custom destinations | $0.25 per GB outbound, per destination | Same | None |
Two gaps in that table matter for budgeting. First, indexing rates for retention windows other than 15 days are shown as “Contact Us for Pricing”, so a 30-day requirement cannot be priced from the public page at all. Second, the overage rate for indexed custom metrics above your allotment is, in Datadog’s own words in the custom metrics billing documentation, “an amount that is specified in your current contract”. Only the ingested overage rate is public, at $0.10 per 100 ingested custom metrics. Every Datadog custom-metric figure below therefore uses that public ingested rate and should be treated as a floor, not a quote.
How a Custom Metric Becomes Forty Custom Metrics
Datadog counts a custom metric as a unique combination of metric name and tag values, including the host tag. Consequently cardinality, not metric count, drives the bill. One gauge tagged with endpoint across 20 routes, on 10 hosts, in 2 environments is not one custom metric. It is 400.
That arithmetic is the single most common cause of a Datadog bill that nobody can explain. Before you add a tag, multiply.
Grafana Cloud’s Rate Card, Read on 23 September 2026
Grafana Cloud’s Pro plan charges a small platform fee, bundles a free allotment, then meters usage. Rates are from the Grafana Cloud pricing page.
| Line item | Pro rate | Included before metering |
|---|---|---|
| Platform fee | $19 per month | Covers the allotments below |
| Metrics | $6.50 per 1k active series | 10k active series, 13-month retention |
| Logs, processed | $0.050 per GB | None |
| Logs, written | $0.400 per GB | 50 GB per month |
| Logs, retained | $0.100 per GB per extra 30-day increment | 30 days |
| Traces | $0.050 process, $0.400 write per GB | 50 GB per month |
| Grafana visualization users | $8.00 per active user | 3 users on Free |
| Kubernetes Monitoring | $0.0100 per host-hour, about $7.20 per host | Free-tier host hours |
| Application Observability | $0.025 per host-hour, about $18 per host | Free-tier host hours |
| Frontend Observability | $0.750 per 1k sessions | 50k sessions on Free |
| Synthetics, API | $5.00 per 10k executions | 100k executions on Free |
| Synthetics, browser | $50.00 per 10k executions | 10k executions on Free |
| k6 load testing | $0.150 per virtual user hour | 500 VU-hours on Free |
| IRM, on-call and incident | $20.00 per active user | 3 users on Free |
| Enterprise plan | Custom | $25,000 minimum annual commitment |
The three-part log charge confuses people, so it is worth stating plainly. Grafana Labs documents that processed volume is what you sent, written volume is what remains after any Adaptive Telemetry drops, and retained volume applies only beyond the included 30 days. At default retention with no filtering, a gigabyte of logs therefore costs $0.05 plus $0.40, or $0.45 per GB all in, with the first 50 GB of writes free each month.
Grafana Cloud’s free tier is also unusually generous for a genuinely small shop: 10k active series, 50 GB of logs, 50 GB of traces, 3 users and 100k synthetic API executions per month, all at $0.
The Log Pricing Difference Nobody Prices Correctly
Here is where the two vendors are not comparable at all. Datadog indexes logs by the event; Grafana Cloud writes them by the gigabyte. Which one is cheaper depends entirely on how big your average log line is, and almost nobody checks before signing.
One gigabyte holds 1,048,576 kilobytes, so at $1.70 per million indexed events plus $0.10 per ingested GB, Datadog’s effective cost per gigabyte of logs looks like this:
| Average log event | Events per GB | Datadog index cost | Plus ingest | Datadog per GB | Grafana Cloud per GB |
|---|---|---|---|---|---|
| 0.5 KB | 2,097,152 | $3.57 | $0.10 | $3.67 | $0.45 |
| 1 KB | 1,048,576 | $1.78 | $0.10 | $1.88 | $0.45 |
| 2 KB | 524,288 | $0.89 | $0.10 | $0.99 | $0.45 |
| 5 KB | 209,715 | $0.36 | $0.10 | $0.46 | $0.45 |
| 10 KB | 104,858 | $0.18 | $0.10 | $0.28 | $0.45 |
The crossover sits just above 5 KB per event. Below that, Grafana Cloud is cheaper on logs, and at the 0.5 to 1 KB event sizes typical of structured JSON application logs it is cheaper by a factor of four to eight. Above 5 KB, which in practice means verbose stack traces, full request and response bodies or CDN logs, Datadog’s event-based indexing wins outright.
Notably, this also explains the classic Datadog mitigation that feels like cheating: stop indexing everything. Ingestion at $0.10 per GB is cheap, and indexing is what costs money, so exclusion filters that ingest-and-archive rather than index are the highest-leverage change available on that platform.
Three Workloads, Priced End to End
To turn rate cards into an observability cost you can act on, all three options are priced against the same three workloads. Every input is stated so you can substitute your own.
| Workload | Hosts | Containers | Custom metrics | Logs per month | Active series (modelled) |
|---|---|---|---|---|---|
| A, small | 10 | 20 | 300 | 30 GB | 15,000 |
| B, mid | 50 | 400 | 5,000 | 300 GB | 75,000 |
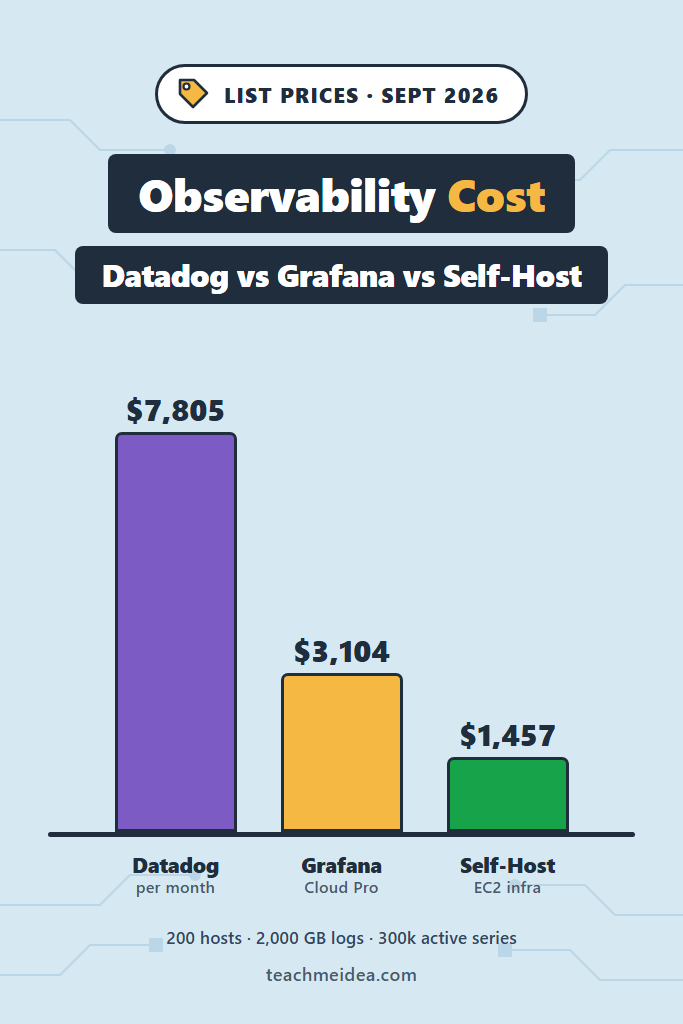
| C, large | 200 | 2,000 | 60,000 | 2,000 GB | 300,000 |
Two modelling assumptions drive the numbers, and both are stated rather than measured. The first is 1,500 active metric series per host, roughly what a node exporter plus a container runtime exporter emits. The second is 1 KB per average log event, which sits in the normal band for structured application logs. Neither is a measurement from this post. Both are the levers to change first if your bill does not match.
Datadog, Priced Per Workload
Infrastructure Pro plus containers, custom-metric overage and logs. APM is excluded here and priced separately below.
| Line | A, small | B, mid | C, large |
|---|---|---|---|
| Infrastructure Pro hosts | $150.00 | $750.00 | $3,000.00 |
| Containers above allotment | $0.00 | $150.00 | $1,000.00 |
| Custom metrics above allotment | $0.00 | $0.00 | $40.00 |
| Log ingestion at $0.10 per GB | $3.00 | $30.00 | $200.00 |
| Log indexing at $1.70 per million | $53.48 | $534.77 | $3,565.16 |
| Monthly total | $206.48 | $1,464.77 | $7,805.16 |
Note what dominates. At every scale, log indexing is either the largest or second-largest line, and at workload C it is 46% of the bill on its own. The per-host price everyone negotiates is not where the money goes.
Grafana Cloud Pro, Priced Per Workload
Platform fee, metered active series, metered log processing and writes, plus visualization users at 5, 15 and 40 respectively.
| Line | A, small | B, mid | C, large |
|---|---|---|---|
| Platform fee | $19.00 | $19.00 | $19.00 |
| Metrics above 10k series, at $6.50 per 1k | $32.50 | $422.50 | $1,885.00 |
| Logs processed at $0.050 per GB | $1.50 | $15.00 | $100.00 |
| Logs written above 50 GB, at $0.400 per GB | $0.00 | $100.00 | $780.00 |
| Visualization users at $8.00 | $40.00 | $120.00 | $320.00 |
| Monthly total | $93.00 | $676.50 | $3,104.00 |
Here metric cardinality dominates instead, at 61% of workload C. Furthermore, because the charge is per active series rather than per host, a single badly-tagged histogram can move the Grafana Cloud bill exactly as fast as it moves the Datadog one. The lever differs; the failure mode does not.
Self-Hosting on EC2, Priced Per Workload
The stack modelled here is Prometheus or Mimir for metrics, Loki for logs, Grafana for dashboards and Alertmanager for routing. It runs on Graviton instances in us-east-1 at on-demand rates, with gp3 for hot storage and S3 Standard for blocks and chunks. Instance rates come straight from the AWS offer file: m7g.large at $0.0816 per hour, m7g.xlarge at $0.1632, and m7g.2xlarge at $0.3264. Storage is gp3 at $0.08 per GB-month and S3 Standard at $0.023 per GB-month for the first 50 TB.
| Line | A, small | B, mid | C, large |
|---|---|---|---|
| Metrics nodes | 1 x m7g.large, $59.57 | 2 x m7g.xlarge, $238.27 | 3 x m7g.2xlarge, $714.82 |
| Logs and dashboards nodes | included above | 1 x m7g.large, $59.57 | 2 x m7g.xlarge, $238.27 |
| gp3 hot storage | 200 GB, $16.00 | 1,000 GB, $80.00 | 4,000 GB, $320.00 |
| S3 blocks and chunks | 100 GB, $2.30 | 1,000 GB, $23.00 | 8,000 GB, $184.00 |
| Monthly infrastructure total | $77.87 | $400.84 | $1,457.09 |
Those totals deliberately exclude the two costs that actually decide the question: engineer time and risk. A one-year Compute Savings Plan would cut the instance lines by roughly a quarter, and the Lambda vs Fargate vs EC2 cost breakdown works through those discount mechanics in detail.
Observability Cost Compared: The Table That Matters
| Workload | Datadog | Grafana Cloud Pro | Self-host infrastructure |
|---|---|---|---|
| A, small, 10 hosts | $206.48 | $93.00 | $77.87 |
| B, mid, 50 hosts | $1,464.77 | $676.50 | $400.84 |
| C, large, 200 hosts | $7,805.16 | $3,104.00 | $1,457.09 |
| Annualized, workload C | $93,661.92 | $37,248.00 | $17,485.08 |
Grafana Cloud lands at 45.0%, 46.2% and 39.8% of the Datadog bill for workloads A, B and C respectively. Self-hosted infrastructure lands between 47% and 84% of the Grafana Cloud bill, and that range is the whole argument: the observability cost saving from running it yourself shrinks toward nothing as the workload shrinks.
What the Self-Hosting Saving Buys in Engineer Hours
Subtract the self-hosted infrastructure cost from the Grafana Cloud bill and you get the monthly budget available for running it yourself. Divide by a loaded engineering rate and you get the honest answer.
| Workload | Monthly headroom | Hours at $100 per hour | Hours at $150 per hour |
|---|---|---|---|
| A, small | $15.13 | 0.15 | 0.10 |
| B, mid | $275.66 | 2.76 | 1.84 |
| C, large | $1,646.91 | 16.47 | 10.98 |
At workload A the self-hosting saving buys nine minutes of engineer time per month, which does not cover reading the Loki release notes, let alone an upgrade. At workload B it buys under three hours, which is roughly one incident. Only at workload C does the arithmetic become defensible, and even there 16 hours a month is a real on-call and upgrade burden for a stack that is not the product.
This result argues against self-hosting more strongly than most build-versus-buy posts do, and it is worth publishing precisely because it contradicts the instinct. Metric and log storage got cheap; the people who keep it running did not.
Where Managed Observability Still Costs Less Than It Looks
A dated observability cost table invites a fair objection: list prices are not what large accounts pay. That is true, and it cuts in a specific direction. Datadog’s public page shows several lines as contract-only, which is a strong signal that meaningful discounting exists above a certain spend, and Grafana Labs publishes a $25,000 minimum annual commitment for its Enterprise plan. Consequently the gap at workload C is narrower in practice than the annualized row suggests, while the gap at workload A is exactly as wide as printed, because nobody is negotiating a $200 bill.
Consider a mid-sized platform team with 40 to 60 services and a single on-call rotation. Over a couple of quarters, the pattern is fairly consistent. The metrics bill grows with cardinality rather than traffic. The log bill grows with one new debug logger somebody left at info level. Consequently, the first serious cost-reduction project is a retention and indexing audit, not a platform migration. The trade-off is real, though. Every gigabyte you stop indexing is a gigabyte you cannot grep during the next incident, which is why the monitoring and logging patterns for microservices guide treats sampling policy as an architecture decision rather than a billing one.
When to Use Each Observability Platform
The tables above give you a number. What follows turns that number into a decision, because observability cost is only one input and the cheapest column is not automatically the right one.
Choose Datadog When
- Your average log event exceeds roughly 5 KB, where event-based indexing beats per-GB pricing
- You need APM, RUM, synthetics, security and infrastructure correlated in one product without integration work
- Your spend is large enough to negotiate, since the public rate card is the worst price available
- Host count is stable but metric cardinality is volatile, because per-host pricing absorbs cardinality up to the allotment
Pick Grafana Cloud When
- Logs are structured JSON in the 0.5 to 2 KB band, where per-GB pricing is four to eight times cheaper
- You want Prometheus, Loki and Grafana semantics without operating them
- Usage is spiky, since metered billing and a genuinely usable free tier both scale down
- You want every rate on a public page you can model before signing
Run Your Own Stack When
- Your workload is large enough that the saving covers more than about 15 engineer hours per month
- Data residency, air-gapped deployment or regulatory constraints rule out a vendor outright
- You already run stateful infrastructure competently, so Mimir and Loki are not your first
- Retention requirements are long and the vendor charge for them is contract-only
When NOT to Use Each Option
Skip Datadog If
- Log volume is high and events are small, which is the single most expensive shape on its rate card
- You need a 30-day indexed retention quote before you can get a contract, since that rate is not public
- Custom metric cardinality is growing faster than host count and the indexed overage rate is unknown to you
Avoid Grafana Cloud If
- Active series per host runs far above the 1,500 modelled here, because metrics become the dominant line fast
- You need one vendor to own security monitoring and SIEM alongside telemetry
- Your team wants a single correlated UI more than it wants a lower bill
Rule Out Self-Hosting If
- You have fewer than about 50 hosts, where the saving does not cover an upgrade cycle
- Nobody on the team has run a stateful distributed system through a failed upgrade
- Your observability stack going down during an incident is unacceptable, since self-hosted means you are debugging both
Common Mistakes With Observability Cost
- Comparing per-host prices to per-series prices without normalizing to a workload, which is the error this post exists to fix
- Budgeting log spend from gigabytes when your vendor bills indexed events, or from events when it bills gigabytes
- Adding a tag without multiplying it out, turning one gauge into several hundred billable custom metrics
- Treating a self-hosted stack as free because the invoice has no vendor name on it
- Pricing the migration and forgetting the parallel-run period, when you pay both bills at once
- Letting one team ship a debug logger at info level, then blaming the vendor for the next invoice
- Using a stale comparison post, including this one, without re-reading the rate cards on the day you decide
Conclusion: Model Your Own Workload Before You Sign
Observability cost comes down to matching your telemetry’s shape to a billing model, not to picking the cheapest logo. On the list prices read on 23 September 2026, Grafana Cloud Pro costs between 40% and 46% of a comparable Datadog bill across all three workloads. Datadog’s log indexing only wins above about 5 KB per event. Below 50 hosts, self-hosting saves so little that the saving is worth minutes of engineer time per month.
The practical next step takes an afternoon. Pull your actual active series count and your average log event size out of your current stack, drop both into the three per-workload tables above, and you will have a defensible number rather than a vendor’s estimate. From there, the highest-leverage cost work is almost always retention and indexing policy, so review your alerting and ingestion rules alongside the bill. For the CloudWatch side of the same question, the CloudWatch logging, metrics and alarms breakdown covers what AWS charges for the same telemetry. Similarly, the AWS cost optimization guide covers the instance and storage levers behind the self-hosted column. If you are weighing a self-hosted telemetry backend for LLM workloads specifically, the self-hosting Langfuse walkthrough shows what the operational burden actually looks like in practice.
Prices here were read on 23 September 2026 and are scheduled for re-reading on 23 December 2026. Vendor rate cards move quarterly, so verify before you commit.