The Bun vs Node vs Deno argument runs on benchmarks nobody re-ran. Bun’s homepage shows a bar chart, Deno’s shows a different one, and both were produced by the team that shipped the runtime. This post takes one ordinary project, installs it three times, boots it three times, and runs the same 1,200 tests under all three runners, with every command and its raw output pasted below. The headline result contradicts the folklore twice: Bun lost the install benchmark badly, and the single biggest number in the whole sweep had nothing to do with which runtime you pick.
How These Bun vs Node vs Deno Numbers Were Produced
A runtime comparison is only worth what its method survives, so the method here is deliberately narrow. One project directory, one dependency list, three runtimes pointed at it. Nothing was tuned for any of them.
Here is the exact environment every number below came from:
Measured 2026-09-04
Windows 11 Pro 25H2 (build 26200), AMD Ryzen 5 8600G (6C/12T), 15.2 GB RAM, NVMe SSD
Node 24.20.0 (npm 11.19.0)
Bun 1.4.1
Deno 2.9.6 (V8 15.0.245.2, TypeScript 6.0.3)
Windows Defender real-time protection: on
Every figure is the median of five runs, and all five raw run times appear next to it. Timings vary between runs, so a single number would not be a result. Each case also gets one discarded warm-up run first, which means no runtime pays for a cold file cache that the others already warmed.
All three runtimes were downloaded as portable archives rather than installed system-wide, so none of them had a shell wrapper, a version manager or a shim adding overhead. The timing harness is fifteen lines of PowerShell that wraps a stopwatch around the process:
function Measure-Runs {
  param([string]$Label, [scriptblock]$Setup, [scriptblock]$Command, [int]$Runs = 5)
  $times = @()
  for ($i = 1; $i -le $Runs; $i++) {
    if ($Setup) { & $Setup | Out-Null }   # reset state between runs, untimed
    [System.GC]::Collect()
    $sw = [System.Diagnostics.Stopwatch]::StartNew()
    & $Command | Out-Null
    $sw.Stop()
    $times += [math]::Round($sw.Elapsed.TotalMilliseconds)
  }
  $sorted = $times | Sort-Object
  "{0,-34} runs: {1}  median: {2} ms" -f $Label, ($times -join ', '), $sorted[[math]::Floor($sorted.Count / 2)]
}
The stopwatch starts before process creation and stops after exit. Consequently these are wall-clock numbers a developer actually waits through, not internal timers the runtime reports about itself.
The Project All Three Runtimes Installed
The subject is a small API server dependency set, chosen because it is dull and common rather than because it flatters anyone. It resolves to 91 packages and roughly 60 MB on disk.
{
  "name": "runtime-bench",
  "type": "module",
  "dependencies": {
    "express": "5.1.0",
    "zod": "3.25.76",
    "pino": "9.7.0",
    "dotenv": "16.6.1",
    "date-fns": "4.1.0",
    "node-fetch": "3.3.2"
  },
  "devDependencies": { "typescript": "5.9.2" }
}
Before trusting any install timing, the resulting trees were compared, because a faster installer that produces less is not faster. Each tool installed from scratch into the same directory, and the tree was then counted:
npm    files:   7217  size:    59.8 MB  package.json count:   98  hard/sym-linked files: 0
bun    files:   7213  size:    59.8 MB  package.json count:   98  hard/sym-linked files: 7207
deno   files:   7295  size:    59.8 MB  package.json count:   96  hard/sym-linked files: 7195
The three trees are equivalent in content. However, they differ in how they got there: npm copies every file out of its cache, whereas Bun and Deno hardlink from theirs. Remember that difference, because it makes the install result stranger rather than simpler.
Install Times: Cold, Warm and No-Op
Three install scenarios matter in practice, and they behave nothing alike. A cold install is CI on a fresh runner with no cache and no lockfile. The warm case is your machine after rm -rf node_modules, with the cache and lockfile left intact. Finally, a no-op install is the one you run out of habit when everything is already in place, which is also the one you run most often.
Each tool used a dedicated cache directory, so “cold” genuinely means cold:
# cold: node_modules, lockfile and cache all removed before each run
npm install --cache ./npmcache --no-audit --no-fund
bun install          # BUN_INSTALL_CACHE_DIR set to a dedicated folder
deno install         # DENO_DIR set to a dedicated folder
Raw output from the harness, five runs each:
npm install (cold)                 runs: 9237, 7175, 6910, 6784, 6951  median: 6951 ms
npm install (warm cache, lockfile) runs: 4243, 4166, 4241, 4078, 4157  median: 4166 ms
npm install (nothing to do)        runs: 434, 433, 425, 432, 428  median: 432 ms

bun install (cold)                 runs: 17721, 15472, 14824, 15615, 14647  median: 15472 ms
bun install (warm cache, lockfile) runs: 6013, 6057, 6229, 7857, 7925  median: 6229 ms
bun install (nothing to do)        runs: 486, 16, 16, 16, 17  median: 16 ms

deno install (cold)                runs: 8664, 5822, 5688, 5748, 5350  median: 5748 ms
deno install (warm cache, lockfile) runs: 774, 797, 848, 804, 791  median: 797 ms
deno install (nothing to do)       runs: 23, 19, 19, 18, 19  median: 19 ms
| Install scenario | npm | Bun | Deno |
|---|---|---|---|
| Cold, no cache or lockfile | 6,951 ms | 15,472 ms | 5,748 ms |
| Warm cache and lockfile | 4,166 ms | 6,229 ms | 797 ms |
| Nothing to do | 432 ms | 16 ms | 19 ms |
Why bun install Lost on Windows
Bun’s reputation is built on install speed, and here it was slowest in both scenarios that involve real work. That result is uncomfortable enough to be worth explaining rather than burying.
The warm number isolates the cause. A warm install has no network in it at all, since the cache is populated and the lockfile pins every version, so the run is pure filesystem work. In that run Bun spent 6,229 ms creating 7,207 hardlinks, while npm spent 4,166 ms copying 7,217 real files, and Deno spent 797 ms creating 7,195 links. Linking is therefore not the slow part, because Deno does the same thing eight times faster. Something in Bun’s Windows filesystem path is.
Notably, the picture inverts completely once there is nothing to do. Bun answers a no-op install in 16 ms against npm’s 432 ms, a 27x difference, and that is the command developers run dozens of times a day. So the honest summary is not “Bun is slow at installing”. It is that Bun is the fastest tool here at deciding it has no work, and the slowest at doing the work, at least on this platform.
Two caveats belong with that finding. First, these numbers are Windows-only, and Bun’s Windows support is younger than its macOS and Linux support, so the same benchmark on a Mac may well rank differently. Second, Defender real-time protection was left on, since that is how the overwhelming majority of Windows developer machines are actually configured. It taxes all three tools, though not necessarily equally.
Boot Times: From Process Start to Useful Work
Startup time only matters when you pay it repeatedly, which is exactly what serverless invocations, CLI tools, watch-mode restarts and test runs all do. Four workloads were measured, escalating from an empty script to a working HTTP request.
node hello.js          # console.log('hello')
node deps.js           # imports express, zod, pino, dotenv, date-fns
node server.js         # express server, listens, fetches its own /health, exits
node hello.ts          # a TypeScript file with an interface, run directly
The equivalents are bun <file> and deno run -A <file>. Raw output:
node hello.js                      runs: 45, 37, 36, 36, 38  median: 37 ms
bun hello.js                       runs: 19, 12, 12, 13, 12  median: 12 ms
deno run hello.js                  runs: 38, 31, 32, 32, 32  median: 32 ms

node deps.js                       runs: 881, 889, 872, 877, 863  median: 877 ms
bun deps.js                        runs: 150, 140, 137, 141, 141  median: 141 ms
deno run -A deps.js                runs: 237, 223, 222, 229, 220  median: 223 ms

node server.js                     runs: 173, 166, 166, 163, 163  median: 166 ms
bun server.js                      runs: 124, 118, 119, 116, 119  median: 119 ms
deno run -A server.js              runs: 182, 181, 170, 175, 167  median: 175 ms

node hello.ts                      runs: 64, 56, 56, 57, 55  median: 56 ms
bun hello.ts                       runs: 19, 12, 12, 13, 12  median: 12 ms
deno run hello.ts                  runs: 37, 33, 33, 33, 32  median: 33 ms
| Boot workload | Node | Bun | Deno |
|---|---|---|---|
| Empty script | 37 ms | 12 ms | 32 ms |
| Import five dependencies | 877 ms | 141 ms | 223 ms |
| Express server to first response | 166 ms | 119 ms | 175 ms |
| TypeScript file, run directly | 56 ms | 12 ms | 33 ms |
Bun wins every row, which is the expected result. Yet the interesting part is the spread. On an empty script the gap is 25 ms, which no user will ever notice. On the dependency import it is 736 ms, which every user will. In other words, the runtime’s own startup cost is a rounding error next to what it does with your imports.
Node’s TypeScript row deserves a note, because it is new. Node 24 strips types natively, so node hello.ts runs without ts-node, tsx or a build step. It costs 19 ms more than the equivalent .js file, against Bun’s 0 ms and Deno’s 1 ms. That is a real gap, but it is also a feature Node did not have two major versions ago.
The One Import That Cost Node 643 Milliseconds
The deps.js figure was suspicious. Importing five packages took Node 877 ms, while booting an actual Express server took 166 ms, and a server is obviously the harder job. Something in the import list was dominating, so each package was measured alone.
node only-datefns-barrel.js   # import { format } from 'date-fns'
node only-datefns-deep.js     # import { format } from 'date-fns/format'
node only-datefns-barrel.js        runs: 770, 755, 748, 742, 734  median: 748 ms
bun only-datefns-barrel.js         runs: 34, 34, 32, 33, 32  median: 33 ms
deno run -A only-datefns-barrel.js runs: 78, 83, 82, 80, 83  median: 82 ms

node only-datefns-deep.js          runs: 105, 105, 104, 106, 108  median: 105 ms
bun only-datefns-deep.js           runs: 25, 24, 25, 24, 25  median: 25 ms
deno run -A only-datefns-deep.js   runs: 46, 41, 39, 41, 40  median: 41 ms
| Import style | Node | Bun | Deno |
|---|---|---|---|
from 'date-fns' (barrel) | 748 ms | 33 ms | 82 ms |
from 'date-fns/format' (deep) | 105 ms | 25 ms | 41 ms |
| Cost of the barrel | 643 ms | 8 ms | 41 ms |
There is the whole benchmark in one table. The date-fns package ships 5,326 files, and its index re-exports all of them, so the barrel import forces the loader to resolve and evaluate the entire package to obtain one function. Node pays 643 ms for that. Bun pays 8 ms, because its resolver and its module evaluation are both far cheaper per file.
Consequently the single-line change from 'date-fns' to 'date-fns/format' saves a Node process more time than switching runtimes would. Bundlers hide this in production builds, since they tree-shake the barrel away. Nothing hides it in a test run, a CLI tool, a serverless cold start or a --watch restart, which is precisely where startup time is felt. Before you migrate a codebase to Bun for boot speed, grep it for barrel imports first.
Test Suite Times: 1,200 Tests, Three Runners
Test time is the number a team pays for on every single push, so it deserves its own measurement. Eight files were generated, each containing 150 tests that do modest real work: a Zod schema parse, a rejection case, and a date format. Every runner executed the identical files, written with node:test and node:assert/strict, which all three now support.
import { test } from 'node:test';
import assert from 'node:assert/strict';
import { z } from 'zod';
import { format } from 'date-fns/format';
import { addDays } from 'date-fns/addDays';

const order = z.object({
  id: z.string().min(3),
  total: z.number().int().nonnegative(),
  placedAt: z.date(),
});

for (let i = 0; i < 50; i++) {
  test('validates order ' + i, () => {
    const parsed = order.safeParse({ id: 'ord-' + i, total: i * 7, placedAt: new Date(0) });
    assert.equal(parsed.success, true);
    assert.equal(parsed.data.total, i * 7);
  });

  test('rejects a negative total ' + i, () => {
    const parsed = order.safeParse({ id: 'ord-' + i, total: -i - 1, placedAt: new Date(0) });
    assert.equal(parsed.success, false);
  });

  test('formats a shipping date ' + i, () => {
    assert.equal(format(addDays(new Date(0), i), 'yyyy-MM-dd').length, 10);
  });
}
Note the deep date-fns imports, which exist because of the previous section. Had the barrel import been left in, this suite would have measured module resolution rather than test execution.
node --test "tests/*.test.js"
bun test tests/
deno test -A --no-check tests/
node --test (1200 tests)           runs: 396, 382, 404, 379, 387  median: 387 ms
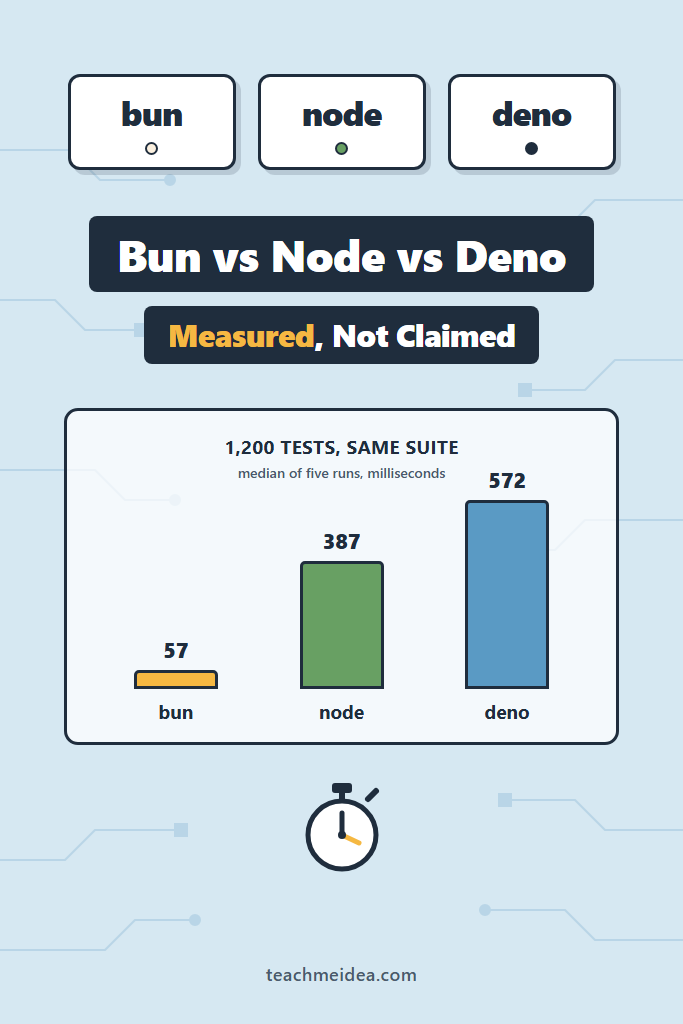
bun test (1200 tests)              runs: 173, 57, 56, 57, 57  median: 57 ms
deno test (--no-check)             runs: 581, 568, 572, 573, 567  median: 572 ms
deno test (type check on)          runs: 1025, 1018, 1021, 1012, 1027  median: 1021 ms
| Test runner | Time for 1,200 tests | Relative to Bun |
|---|---|---|
bun test | 57 ms | 1.0x |
node --test | 387 ms | 6.8x |
deno test --no-check | 572 ms | 10.0x |
deno test (default) | 1,021 ms | 17.9x |
Bun’s test runner is in a different class, and this is the result that most deserves its reputation. A 57 ms suite is fast enough to run on every keystroke rather than every save, which changes how you work rather than just how long you wait.
Deno’s Default Type Check Doubles the Run
Deno type-checks by default, and that default costs 449 ms on this suite, or 78 percent on top of execution. That is a defensible trade, since a type error caught during a test run is a real check the other two are not performing. Still, it belongs in the comparison explicitly rather than silently.
The first attempt at the type-checked run did not merely run slowly. It failed:
error: Could not find a matching package for 'npm:@types/node' in the node_modules directory.
Both node --test and bun test ran the same files without complaint, because neither type-checks. Deno needed @types/node present in node_modules before it would agree to check a file that imports node:test, and installing it fixed the error. It is a two-minute fix, but it is the kind of friction that shapes an adoption decision, so it is reported rather than smoothed over.
What This Changes in a Real Project
Consider a small team maintaining a mid-sized TypeScript API, perhaps thirty route modules and a suite in the low thousands of tests, where CI takes long enough that people stop watching it. The instinct after reading a runtime benchmark is to open a migration ticket for Bun, which is roughly a week of work: the CI images change, every native dependency gets re-verified, and the whole team learns a new lockfile.
The numbers above suggest a cheaper order of operations. First, grep for barrel imports, since a handful of them can cost more per process than the runtime does. Next, swap the test runner alone, because bun test can run a node:test suite without touching the production runtime or the deployment target. Finally, if CI install time is the actual complaint, note that Bun was the slowest installer measured here while Deno’s warm install finished in 797 ms.
The trade-off is real, though. Running tests on Bun while shipping on Node means your tests no longer execute on the runtime that serves production, and the differences that matter are exactly the obscure ones: streams, worker threads, native addons, and timing edge cases. For a suite that is mostly pure logic, that risk is small and the gain is large. For a suite full of integration tests against native modules, it inverts. That judgement, rather than any single number above, is what the Bun vs Node vs Deno decision actually turns on.
When to Use Bun, Node or Deno
Bun Is the Right Default When
- Startup cost is paid constantly, as in CLI tools, serverless functions or watch-mode development
- The test suite is large and mostly pure logic, where the 6.8x margin over
node --testcompounds on every push - You want TypeScript and JSX to run directly with no build step and no configuration
- Your dependencies are pure JavaScript, so Node API compatibility gaps are unlikely to surface
Node Still Wins When
- Production stability outranks startup speed, and the LTS release line is worth more than 25 ms
- The project depends on native addons, obscure
node:internals or tooling that assumes npm’s exact resolution - Hiring, documentation and library support matter, since every package is tested against Node first
- You want TypeScript execution without a toolchain, which Node 24 now provides natively
Reach for Deno When
- Cold and warm installs dominate your CI bill, where Deno’s 797 ms warm install beat both alternatives decisively
- You want type checking enforced at run time rather than as a separate build step someone can skip
- Permission-scoped execution is a genuine requirement, such as running untrusted or generated code
- The team is starting fresh, so there is no existing npm-shaped toolchain to fight
When NOT to Use Bun, Node or Deno
- Avoid adopting Bun for install speed on Windows on the strength of published benchmarks, because this measurement found it slowest on both cold and warm installs
- Skip a wholesale Bun migration for a service that leans on native modules or worker threads until you have run your real suite against it
- Staying on Node purely to avoid learning a second runtime is the weakest reason of all, since
bun testcan be adopted alone without touching production - Deno is the wrong pick when your project’s value sits in npm packages that assume a Node-shaped
node_modules, as the compatibility layer is good but not invisible - None of the three deserves a decision made on boot time alone, given that one barrel import outweighed the entire runtime difference here
Common Mistakes with Runtime Benchmarks
- Comparing installers without comparing the trees they produced, which is how a tool that installs less looks faster
- Reporting one run, when the first run of
bun installhere was 486 ms against a 16 ms median for the same command - Benchmarking a cold install with a shared cache, so the second tool measured inherits the first tool’s downloads
- Leaving a barrel import in the code under test, which measures module resolution and calls it startup time
- Comparing
deno testagainstnode --testwithout stating that only one of them type-checks - Trusting a runtime’s own published chart, since every vendor picks the workload where it wins
- Generalizing a Windows result to macOS, or the reverse, when filesystem behaviour is exactly what several of these numbers measure
What This Benchmark Does Not Measure
Naming the gaps matters more than the numbers, because an unstated limitation turns a measurement into a trap.
This sweep covers one machine, one operating system and one dependency set. Throughput is absent entirely, so nothing here says which runtime serves more requests per second under load. Memory is unmeasured. Native addon compatibility, which is where most real Bun and Deno migrations actually stall, was never exercised, since every dependency chosen is pure JavaScript. The test suite is deliberately CPU-light and has no I/O, no mocking and no snapshots, meaning it measures runner overhead rather than a realistic mixed suite. Finally, all three runtimes were pinned to the versions in the environment block, and each of these projects ships often enough that the ranking can move within a quarter.
For related ground this site already covers, our walkthrough of Deno as a TypeScript and JavaScript runtime explains the permission model these timings run under, while unit testing with Jest and Vitest covers the runners most teams are actually migrating away from. If install time is your bottleneck, monorepo tooling with Nx or Turborepo attacks the same problem from the caching side, and CI/CD for Node.js projects with GitHub Actions is where a cold install actually costs money. On the application side, our guide to a scalable Express.js project structure describes the shape of the server booted in the measurements above.
Conclusion
On this machine and this project, the Bun vs Node vs Deno result splits three ways rather than crowning a winner. Bun owns startup and testing, finishing 1,200 tests in 57 ms against Node’s 387 ms and Deno’s 572 ms. Deno owns installing, completing a warm install in 797 ms while Bun needed 6,229 ms for identical output. Node wins nothing outright, yet it loses nothing by enough to justify a migration on these numbers alone.
The finding worth acting on today is smaller and cheaper than any of that. One barrel import cost Node 643 ms of startup, which is more than the entire gap between the three runtimes on the same workload. So before you schedule a migration, run node --test on your suite, then change your widest barrel import to a deep one and run it again. If that closes most of the gap you were about to spend a week chasing, the runtime was never the problem.