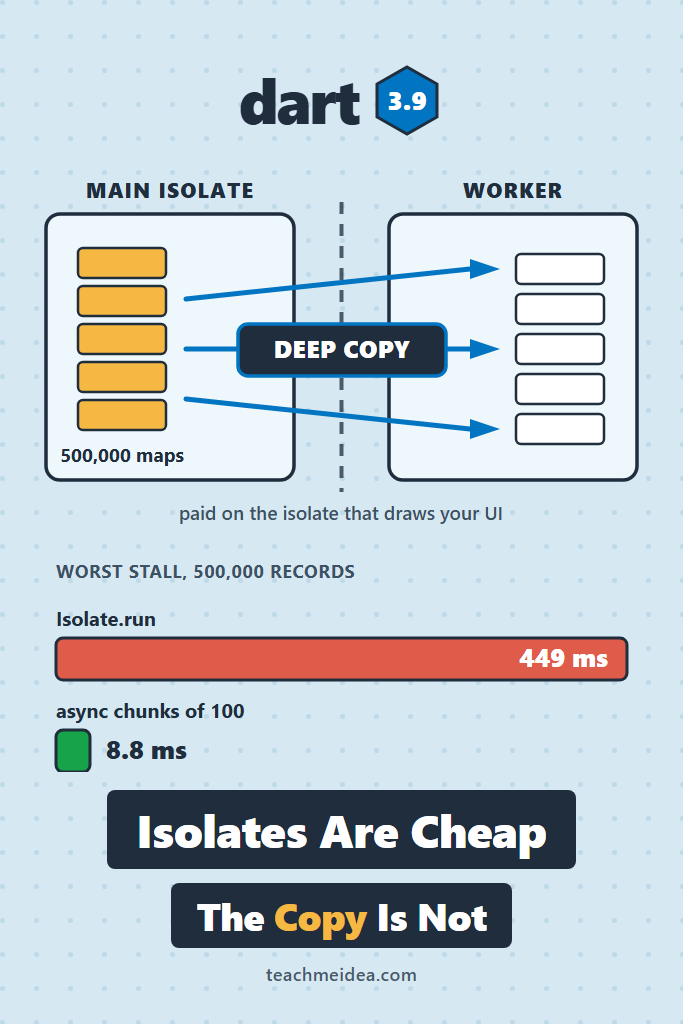
The standard advice about Dart isolates runs like this. Heavy work belongs in compute(), so the UI thread stays free. Isolates are also expensive to spawn, so you should not reach for them casually. This benchmark ran the sweep, and both halves of that advice turn out to be backwards. Spawning an isolate costs 0.05 milliseconds, which is nothing. Handing it a list of 500,000 maps blocks the main isolate for 458.58 milliseconds. Doing the whole job inline, spawning nothing at all, takes 383.00 milliseconds. The threshold that decides whether compute() helps is not how much work you have. It is what shape the data crossing the boundary is in.
Below are the commands, the raw output and the environment they came from. Every number here can therefore be re-run or refuted.
How These Dart Isolates Numbers Were Produced
Measured 2026-09-08
Windows 11 Pro 25H2 (build 26200.9168), AMD Ryzen 5 8600G (6C/12T), 15.2 GB RAM
Kingston SNV2S1000G NVMe SSD
Dart 3.9.0, Flutter 3.35.2
AOT: dart compile exe, which is what a Flutter release build runs
JIT: dart run and flutter test, which is what a debug build runs
Two numbers are recorded for every run. The first is wall time, from a Stopwatch around the call. The second matters more, and it is rarely reported. That is the maximum event-loop stall, meaning the longest window in which the main isolate could not run anything. A 1 ms periodic timer records the gap between consecutive ticks. The largest gap in the window is the stall. That number is what a dropped frame is made of. After all, Flutter cannot build, lay out or paint while the event loop is blocked.
import 'dart:async';
import 'dart:math';

class StallSampler {
  final List<int> _gaps = <int>[];
  final Stopwatch _sw = Stopwatch();
  Timer? _timer;
  int _last = 0;

  void start() {
    _sw.start();
    _last = _sw.elapsedMicroseconds;
    _timer = Timer.periodic(const Duration(milliseconds: 1), (_) {
      final int now = _sw.elapsedMicroseconds;
      _gaps.add(now - _last);
      _last = now;
    });
  }

  int stopMaxGapUs() {
    _timer?.cancel();
    final int now = _sw.elapsedMicroseconds;
    _sw.stop();
    // The window between the last tick and the stop is also a gap in which no
    // timer ran. Without it, a run shorter than one tick reports nothing.
    _gaps.add(now - _last);
    return _gaps.reduce(max);
  }
}
Every configuration runs once to warm up and then five times for record. Every value in this post is the median of those five runs. The sampler has a noise floor, and it had to be measured before anything else could be trusted. Consequently the harness prints it first:
sampler baseline, event loop idle 300 ms:  19.83 ms max gap
sampler baseline, event loop yielding 300 ms: 1.24 ms max gap
That first line is the important caveat. When the process is genuinely idle, Windows coalesces timers. The sampler then shows gaps up to 19.83 ms that nothing caused. Every measured run is actually in a different state: busy but yielding. There the floor drops to 1.24 ms. Consequently the stall figures below are trustworthy down to roughly 1.5 ms. No claim in this post rests on a smaller difference than that.
The Workload Both Strategies Ran
The subject is the most common heavy job in a Flutter app: normalizing a decoded API response. Each record gets a string parsed to a double, a multiplication, two string operations and a split. It is deliberately ordinary, and importantly it is per item, which means it can be chunked.
Map<String, Object?> transformOne(Map<String, Object?> m) {
  final double price = double.parse(m['price']! as String);
  final int qty = m['qty']! as int;
  final List<String> tags = (m['tags']! as String).split(',');
  return <String, Object?>{
    'id': m['id'],
    'sku': (m['sku']! as String).toLowerCase(),
    'label': (m['name']! as String).trim().toUpperCase(),
    'total': price * qty * 1.2,
    'tagCount': tags.length,
  };
}
Three strategies process the same records. The first runs the loop straight through on the main isolate. The second yields to the event loop every N items, which is the “just make it async” approach. The third hands the whole list to Isolate.run.
Future<List<Map<String, Object?>>> transformChunked(
  List<Map<String, Object?>> rows,
  int chunk,
) async {
  final List<Map<String, Object?>> out = List<Map<String, Object?>>.filled(
    rows.length,
    const <String, Object?>{},
  );
  for (int i = 0; i < rows.length; i++) {
    out[i] = transformOne(rows[i]);
    if ((i + 1) % chunk == 0) {
      await Future<void>.delayed(Duration.zero);
    }
  }
  return out;
}
Note what await does and does not do here. An await inside a synchronous loop yields nothing on its own. Only reaching a suspension point hands control back to the event loop. Marking a function async therefore does not make CPU work non-blocking. That is the single most common misreading of async and await as a concurrency tool in any event-loop language.
Spawning an Isolate Costs 0.05 Milliseconds
The first measurement kills the oldest piece of folklore. Isolate.run with an empty body, 50 runs after 5 warm-up runs:
dart compile exe bin/bench.dart -o bench.exe
./bench.exe spawn
Isolate.run(() => 0), 50 runs after 5 warm-up runs
  min    0.04 ms
  median 0.05 ms
  p90    0.06 ms
  max    0.06 ms
The same code under JIT, which is what flutter run gives you in debug mode:
Isolate.run(() => 0), 50 runs after 5 warm-up runs
  min    0.12 ms
  median 0.17 ms
  p90    0.26 ms
  max    0.33 ms
Fifty microseconds in a release build. Since Dart 2.15 an Isolate.run isolate joins the existing isolate group. It shares the runtime’s code and heap structures rather than bootstrapping a fresh VM. Consequently what used to be a meaningful cost is now a rounding error. Spawn overhead is therefore never the reason to avoid compute(). Something else is.
The Copy at the Boundary Is the Whole Cost
Isolates share no mutable memory, so everything sent across is deep-copied, and that copy runs on the sending isolate. This is the part the advice leaves out: your UI thread pays for the transfer, not the worker. Round-tripping a List<int> through Isolate.run shows the shape of it:
./bench.exe transfer
elements      round-trip ms  max stall ms
1024                   0.07          0.07
16384                  0.11          0.11
131072                 0.43          0.43
1048576                3.83          3.75
4194304               12.28          8.31
A million integers out and back in 3.83 ms is respectable. The stall column tracks the wall time almost exactly, which confirms the point. For the duration of a transfer, the main isolate is not idle waiting on a worker. It is busy copying.
The Sweep: Inline, async Chunking and Isolate.run
Here is the full result, six workload sizes against six strategies. The last two rows of each block exist to split the cost apart. “Count back” returns a single integer rather than the transformed list. It therefore pays the input copy but not the output copy. “No work” returns immediately without transforming anything, so it pays the input copy alone.
./bench.exe sweep
records  strategy                 wall ms  max stall ms
1000     sync inline                 0.54          0.55
1000     async chunk 100             0.50          0.50
1000     async chunk 1000            0.36          0.36
1000     Isolate.run                 0.63          0.63
1000     Isolate.run, count back      0.54          0.54
1000     Isolate.run, no work        0.20          0.20

5000     sync inline                 2.18          2.20
5000     async chunk 100             1.85          1.51
5000     async chunk 1000            1.84          1.47
5000     Isolate.run                 3.18          3.19
5000     Isolate.run, count back      2.54          2.55
5000     Isolate.run, no work        0.64          0.65

20000    sync inline                10.61         10.63
20000    async chunk 100             8.11          1.82
20000    async chunk 1000           10.46          3.89
20000    Isolate.run                22.01         16.02
20000    Isolate.run, count back     17.85         11.97
20000    Isolate.run, no work        3.51          3.42

50000    sync inline                35.61         35.63
50000    async chunk 100            36.47          6.93
50000    async chunk 1000           36.57          6.82
50000    Isolate.run                86.28         28.21
50000    Isolate.run, count back     64.38         27.48
50000    Isolate.run, no work       31.94         31.69

200000   sync inline               150.56        150.58
200000   async chunk 100           154.62          7.64
200000   async chunk 1000          156.26          8.31
200000   Isolate.run               368.35        168.74
200000   Isolate.run, count back    345.19        190.87
200000   Isolate.run, no work      176.43        176.19

500000   sync inline               382.96        383.00
500000   async chunk 100           389.38          8.79
500000   async chunk 1000          386.15         13.93
500000   Isolate.run               986.78        449.28
500000   Isolate.run, count back    872.59        476.75
500000   Isolate.run, no work      458.96        458.58
Read the bottom block first, because it is the result that contradicts the advice. At 500,000 records, doing the entire job inline blocks the main isolate for 383 ms. Sending the list to an isolate and doing nothing with it blocks the main isolate for 459 ms. The copy alone costs 20% more than the work it was supposed to offload. Meanwhile the full Isolate.run round trip blocks for 449 ms and takes 987 ms of wall time. On this workload compute() is not a smaller jank. It is a bigger jank, and it takes two and a half times longer to finish.
Meanwhile the chunked async version holds its worst stall at 8.79 ms across the same 500,000 records. Total wall time matches the inline loop. At 200,000 records it is 7.64 ms against the inline loop’s 150.58 ms. That is a twenty-fold reduction in the worst frame, and it costs 4 ms of wall time.
One row deserves a caveat rather than a claim. At 20,000 records the chunked run came in at 8.11 ms against the inline loop’s 10.61 ms. That reads as chunking being faster than not chunking. In a separate run of the same sweep the ordering reversed. Honestly read, the two are equal on wall time at that size, and the difference is allocation and GC timing.
Copying a Map Costs More Than Transforming It
Divide the wall time on the “no work” rows by the record count. The per-record copy cost falls out at 0.64 µs for 50,000 records, 0.88 µs at 200,000 and 0.92 µs at 500,000. The inline transform itself costs 0.71 µs, 0.75 µs and 0.77 µs per record over the same sizes.
Copying one six-key map across an isolate boundary costs roughly as much as normalizing it. So consider any job whose work per item is comparable to a few string operations. It can never win by moving that item to another isolate, because the postage exceeds the labour. The rule generalizes. An isolate pays off only when the work-to-payload ratio is high, and object graphs make that ratio terrible.
Where compute Wins: Work You Cannot Chunk
Async chunking has one hard limitation. It requires the work to be divisible, and the single most common heavy operation in a Flutter app is not. jsonDecode runs to completion inside the C++ parser and offers no yield point. So a 27 MB response blocks the event loop for as long as it takes. No amount of async changes that.
This is where the copy argument reverses, because the payload going in is a String rather than an object graph:
./bench.exe atomic
5000 records, 0.67 MB of JSON
  jsonDecode on main isolate             2.71 wall      2.71 stall
  jsonDecode inside Isolate.run          2.42 wall      2.42 stall
  decode + transform, count returned     4.50 wall      4.47 stall
  decode + transform, rows returned      5.01 wall      4.74 stall

50000 records, 6.77 MB of JSON
  jsonDecode on main isolate            35.68 wall     35.70 stall
  jsonDecode inside Isolate.run         36.94 wall     15.74 stall
  decode + transform, count returned    70.34 wall     20.82 stall
  decode + transform, rows returned     90.54 wall     18.22 stall

200000 records, 27.34 MB of JSON
  jsonDecode on main isolate           144.37 wall    144.39 stall
  jsonDecode inside Isolate.run        147.71 wall     21.83 stall
  decode + transform, count returned   284.09 wall     22.88 stall
  decode + transform, rows returned    329.60 wall     23.20 stall
At 27.34 MB, decoding on the main isolate blocks it for 144 ms. That is nine dropped frames at 60 Hz. Decoding inside Isolate.run blocks it for 21.83 ms. That residue is the cost of handing over the string plus receiving the result. Wall time is unchanged at 147.71 ms against 144.37 ms, so nothing got faster. The block simply moved off the thread that draws.
Put the two experiments side by side and the finding is stark. As one JSON string, 200,000 records cost about 22 ms to send. As a list of maps, the same records cost 176 ms. Serialized text therefore crosses the boundary roughly eight times more cheaply than the object graph it decodes into. One string is a single contiguous allocation. By contrast, 200,000 maps are 200,000 hash tables, and each one must be walked, allocated and rehydrated.
The practical consequence is a rule you can apply without measuring anything: decode inside the isolate, not outside it. If a response arrives as bytes or text, hand the isolate the raw payload and let it parse. Never parse on the main isolate and then send the parsed objects. That is precisely what the common compute(parseResponse, jsonDecode(body)) idiom does.
import 'dart:convert';
import 'package:flutter/foundation.dart';
import 'package:http/http.dart' as http;

class Product {
  const Product({required this.id, required this.label, required this.total});

  final int id;
  final String label;
  final double total;
}

// Runs entirely inside the worker isolate: the boundary carries one String in
// and the finished list out.
List<Product> _parseProducts(String body) {
  final List<Object?> raw = jsonDecode(body) as List<Object?>;
  return raw.cast<Map<String, Object?>>().map((Map<String, Object?> m) {
    return Product(
      id: m['id']! as int,
      label: (m['name']! as String).trim().toUpperCase(),
      total: double.parse(m['price']! as String) * (m['qty']! as int) * 1.2,
    );
  }).toList(growable: false);
}

Future<List<Product>> fetchProducts(Uri url) async {
  final http.Response response = await http.get(url);
  if (response.statusCode != 200) {
    throw http.ClientException('HTTP ${response.statusCode}', url);
  }
  return compute(_parseProducts, response.body);
}
compute and Isolate.run Are the Same Thing
On every platform that has dart:io, compute() is a nine-line wrapper over Isolate.run. That is not an inference. It is the whole body of the function in packages/flutter/lib/src/foundation/_isolates_io.dart, as shipped in Flutter 3.35.2:
@pragma('vm:prefer-inline')
Future<R> compute<M, R>(
  isolates.ComputeCallback<M, R> callback,
  M message, {
  String? debugLabel,
}) async {
  debugLabel ??= kReleaseMode ? 'compute' : callback.toString();

  return Isolate.run<R>(() {
    return callback(message);
  }, debugName: debugLabel);
}
A flutter test run confirms the two behave identically. One caveat comes first. This harness returns a count rather than building and returning the transformed list. Its absolute milliseconds are therefore not comparable to the AOT table above. What it establishes is the ordering.
flutter test
inline, no isolate                        23.50 wall     23.56 stall
compute(rows)                             72.12 wall     44.37 stall
Isolate.run(rows)                         68.84 wall     44.90 stall
compute(json string)                      61.89 wall     15.71 stall
Isolate.run(json), rows also in scope    113.45 wall     35.70 stall
Isolate.run(json), narrow scope           69.65 wall     17.54 stall
At 50,000 records, compute(rows) and Isolate.run(rows) land within noise of each other on both columns. That is exactly what the source says should happen, so pick whichever reads better at the call site. More usefully, the string payload beats the object payload here too, cutting the stall from 44.37 ms to 15.71 ms. That is the same direction as the AOT sweep, though the JIT gap is the wider of the two. One rule follows. A debug-mode profile tells you which approach wins, while only a release build tells you by how much.
The Closure Captures More Than You Passed
The last two rows above are a trap worth knowing. Both call Isolate.run with a closure that uses only the JSON string. One of them sits in a scope where a 50,000-element List<Map> is also alive. The other is wrapped in a helper whose only local is the string:
// Only the string is in scope, so only the string can be captured.
Future<int> runInNarrowScope(String json) =>
    Isolate.run(() => decodeAndCount(json));
Under JIT the wide-scope version costs 113.45 ms against 69.65 ms, and 35.70 ms of stall against 17.54 ms. The effect reproduced on all three repeat runs. Under AOT, however, the same comparison came out at 80.63 ms against 69.52 ms, and the stall columns overlapped. One of three repeat runs reversed the order entirely. So state it precisely. The closure context is a real cost in debug builds, and mostly optimized away in release builds. Wrapping the call in a narrow helper is still worth doing. It costs nothing, it removes the debug-mode penalty, and it drops any dependence on which compiler you are running.
Parallelism Only Pays When the Interface Is Cheap
The other reason to reach for isolates is throughput rather than smoothness. Six physical cores should process six shards at once. Sharding the object-graph workload across isolates says otherwise:
./bench.exe parallel
sync inline, no isolate           377.03 ms
1 parallel Isolate.run            858.93 ms
2 parallel Isolate.run            788.92 ms
4 parallel Isolate.run            642.78 ms
6 parallel Isolate.run            649.95 ms
12 parallel Isolate.run           619.58 ms
Twelve isolates on six cores are still 64% slower than one thread working alone. Every shard has to be copied, and those copies happen one after another on the sending isolate. Parallelism cannot outrun a serialized boundary.
Shard the same data as JSON strings instead, returning only a count, and the cores finally show up:
./bench.exe parallel-json
payload: 27.34 MB of JSON, 200000 records
decode + transform, main isolate      323.43 ms
1 parallel isolates, JSON in          297.18 ms
2 parallel isolates, JSON in          234.47 ms
4 parallel isolates, JSON in          130.23 ms
6 parallel isolates, JSON in          173.89 ms
12 parallel isolates, JSON in         141.14 ms
Four isolates finish in 130.23 ms against 323.43 ms single-threaded, a 2.5x speedup. Adding more stopped helping, and the ordering above four is not even monotonic. The six-shard run at 173.89 ms landed above the twelve-shard run at 141.14 ms. Once shards get small, copy and spawn costs eat the gain. Run-to-run scheduling noise then decides the rest. Identical data, identical work, identical core count. Only the shape of the payload changed.
The Thresholds in One Table
| Situation | Fastest correct choice | Measured worst stall |
|---|---|---|
| Work under ~10 ms total | Leave it inline | 10.61 ms at 20,000 records |
| Chunkable work, any size | Yield every ~100 items | 8.79 ms at 500,000 records |
| Atomic work, text or byte payload | compute() on the raw payload | 21.83 ms on 27.34 MB of JSON |
| Object graph crossing the boundary | Do not use an isolate | 458.58 ms to send 500,000 maps |
| CPU-bound throughput, cheap payload | 4 parallel isolates | 130.23 ms against 323.43 ms inline |
What This Costs a Real Screen
Consider a product catalogue screen that pulls 50,000 rows on first load and normalizes them before the list renders. Write it the ordinary way, with jsonDecode on the main isolate followed by an inline transform. The numbers above then add up to 35.68 ms of decode plus 35.61 ms of transform. That is 71.29 ms in which the app cannot draw. At 60 Hz that is more than four frames’ worth of budget, missed on entry to the screen. On a 120 Hz panel it is more than eight. Users do not read that as slow loading, because a spinner is expected. They read it as the tap not registering, since the frame that would have shown the pressed state never rendered.
Move both steps into one compute() call that receives response.body and returns the finished list. The blocked window drops to 18.22 ms, a single dropped frame. The more common refactor moves only the transform into compute(), while decoding stays on the main isolate. That produces 35.68 ms of decode plus 27.48 ms of copy. So 63.16 ms, and no meaningful improvement at all. The refactor that feels like the careful one is worth 8.13 ms.
There is a third option nobody reaches for. Keep everything on the main isolate, but chunk the transform at 100 items. That gives 35.68 ms of decode plus a 6.93 ms worst stall, so 42.61 ms. That beats the popular refactor. Better still, it needs no isolate, no top-level function and no thought about what is sendable. The reason to prefer compute() here is the decode, not the transform.
Choosing Between Inline, async and compute
Keep it inline when the work fits in a frame
Anything under roughly 10 ms should stay exactly where it is. At 20,000 records this workload took 10.61 ms inline against 22.01 ms through Isolate.run. So the isolate doubled the wall time. It also pushed the worst stall from 10.63 ms to 16.02 ms. Below that threshold every alternative is slower and more complex, and the complexity is what breaks later.
Reach for chunking when the work divides
Per-item loops, list normalization, filtering, sorting in passes and image post-processing in tiles all divide cleanly. Chunking never let the worst stall exceed 13.93 ms at any size measured, up to half a million records. Because the data never leaves the isolate, there is no sendability constraint. Closures and non-sendable types are fine, and progress reporting is a one-line addition. Chunk at 100 items rather than 1,000. Both cost the same wall time, and the smaller chunk halved the stall at 20,000 records.
Move to compute when the payload is text and the work is not divisible
jsonDecode, image decode, compression, hashing and crypto are single indivisible calls. Chunking is therefore unavailable, and the isolate is the only tool left. Send the raw string or byte list, do the parse inside, and return the smallest useful result. On 27.34 MB of JSON that pattern turned a 144 ms block into a 22 ms one.
Fan out to several isolates only for long CPU work behind a cheap interface
Four isolates delivered 2.5x on a 323.43 ms job whose input was text. Six and twelve shards both finished behind four. The same fan-out on an object-graph input was slower than not parallelizing at all, at every shard count tried. Consequently the question to ask before sharding is never how many cores the phone has. It is how expensive one shard is to send.
When NOT to Reach for compute
Skip it whenever an object graph crosses the boundary
Sending 500,000 maps blocked the main isolate for 458.58 ms. The entire job takes 383.00 ms inline. The copy is not a tax on the offload. At that size the copy is the offload, so no amount of worker-side speed can help.
Avoid it for work already under one frame
Isolating a 2 ms job turns it into a 3.18 ms job, for no benefit whatsoever. Worse, it converts a synchronous value into a Future that every caller must now await. That cost lands in the code, not the profiler.
Do not use it to fix a slow build method
If a screen janks while scrolling rather than while loading, the problem is almost certainly rebuild scope rather than computation. No isolate touches that. The measured rebuild counts for Riverpod and Bloc address that failure mode directly. So does the broader Flutter performance optimization checklist.
Resist it in build, initState and anything on the frame path
compute() returns a Future, so calling it from a build method starts a fresh isolate on every rebuild. Under JIT that is 0.17 ms of spawn plus the full copy, every time. That is how a fix becomes the regression.
Common Mistakes with Dart Isolates
- Decoding JSON on the main isolate, then sending the decoded objects to
compute() - Believing
asyncandawaitmake CPU work non-blocking, when only an actual suspension point yields to the event loop - Avoiding isolates because spawning is expensive, a claim this machine measures at 0.05 ms in AOT
- Benchmarking in a debug build, then reading the milliseconds rather than the ratios
- Returning the full transformed list when the widget only needs a count, a page or an ID set
- Assuming more shards is always better, when four isolates beat both six and twelve on the fan-out that actually worked
- Calling
Isolate.runfrom a scope holding large unrelated locals instead of a narrow helper function - Measuring wall time alone and declaring victory, when the number the user feels is the stall
What This Benchmark Does Not Measure
Naming the gaps matters more than the numbers, since an unstated limitation turns a measurement into a trap.
This is one machine, one desktop operating system and one workload. A phone has slower cores, less memory bandwidth and a thermal budget. So the absolute milliseconds will be worse on real devices. The copy-versus-work ratio, which is what every conclusion here rests on, should still hold. Nothing here was measured on Android or iOS hardware, and nothing ran through Flutter’s actual frame pipeline. So “stall” is an event-loop measurement, not a count of dropped frames from the engine’s own timeline. TransferableTypedData moves byte buffers without copying, and it was not tested. It is the documented escape hatch for exactly the problem this post spends most of its length on. Long-lived worker isolates with a ReceivePort amortize setup across many jobs, and they were not measured either. They are the right structure when the same worker runs repeatedly rather than once. Web builds compile to JavaScript, where isolates are not available in this form at all. Finally, Dart 3.9.0 and Flutter 3.35.2 are one point in a moving target. The isolate group work that made spawning cheap is recent, so older SDKs will give materially different spawn numbers.
This site already covers neighbouring ground. The Dart language features worth knowing piece covers the syntax these benchmarks use. The measured Flutter package size costs post uses the same machine and the same reporting rules on binary size.
Conclusion
Dart isolates are cheap to create and expensive to talk to. That is the opposite of what the common advice assumes. Spawning costs 0.05 ms. Sending 500,000 maps costs 459 ms, on the main isolate, before the worker does anything. So the decision is not about how much work you have. It is about what has to cross the boundary.
The rule that falls out of every table above is short enough to remember. If the work divides, chunk it and stay on the main isolate. That held the worst stall under 14 ms at every size measured. If the work does not divide, use compute() and send the payload in its rawest form, as text or bytes. Return the smallest result the UI actually needs.
The next action is a five-minute check rather than a refactor. Search your codebase for compute( and look at what each call receives. Every call site handed a List or a Map is paying the copy this benchmark measured. Move the parse inside the isolate, so the boundary carries a string instead. That is usually a change of two lines. Then run the sampler above around the call, and compare the stall before against after. Only the numbers from your data on your device decide your screen.