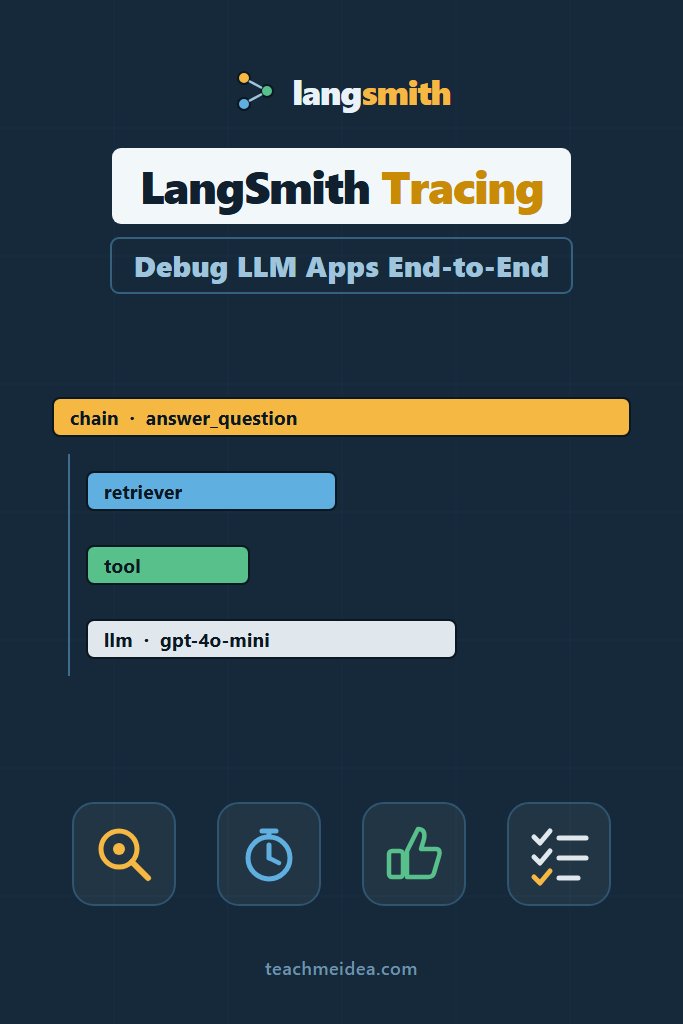
If you have ever stared at a wrong answer from your RAG pipeline and had no idea which of the eight steps produced it, LangSmith tracing solves exactly that problem. This guide is for backend and AI engineers running LLM features in production who need visibility into what the model actually saw, what the retriever actually returned, and where latency and cost are hiding. By the end, you will know how to instrument any Python or TypeScript app, read a trace properly, filter traces at scale, and turn real production failures into regression tests.
Traditional logging breaks down here. An LLM call is not a deterministic function, so a stack trace tells you nothing useful. What you need instead is a structured record of nested steps with their inputs, outputs, timings, and token counts. That is what a trace gives you.
What Is LangSmith Tracing?
LangSmith tracing is an observability system for LLM applications that records each step of a request as a nested tree of runs. Every run captures its inputs, outputs, latency, token usage, errors, and metadata. Because the tree preserves parent-child relationships, you can see exactly how a prompt was assembled before the model ever saw it.
The vocabulary matters, so here it is once. A run is a single unit of work, such as one retriever call or one model invocation. A trace is the full tree of runs for one request, identified by the root run. A project is a bucket of traces, usually one per service and environment. Runs also carry a run_type, which tells the UI how to render them: llm, retriever, tool, chain, prompt, or parser.
Importantly, LangSmith does not require LangChain. That is the single most common misconception. If you use LangChain or LangGraph for stateful agents, tracing is automatic. However, a plain FastAPI service calling the OpenAI SDK directly gets the same treatment with two lines of code.
How to Set Up LangSmith Tracing in Five Steps
- Create an account at smith.langchain.com and generate an API key from Settings.
- Install the SDK:
pip install langsmithfor Python, ornpm install langsmithfor TypeScript. - Set
LANGSMITH_TRACING=trueandLANGSMITH_API_KEY=<your key>in your environment. - Set
LANGSMITH_PROJECTto something environment-specific, such assupport-bot-prod. - Wrap your model client or decorate your entry point, then send one request and confirm the trace appears.
Here is the minimal environment setup. Notably, the LANGSMITH_ENDPOINT variable only matters if you are on the EU region or a self-hosted instance.
# .env — never commit real keys
LANGSMITH_TRACING=true
LANGSMITH_API_KEY=lsv2_pt_xxxxxxxxxxxxxxxx
LANGSMITH_PROJECT=support-bot-prod

# Only for EU data residency or self-hosted deployments.
# Omit this line entirely for the default US cloud.
# LANGSMITH_ENDPOINT=https://eu.api.smith.langchain.com
Use a separate project per environment. Otherwise your local experiments pollute production dashboards, and every latency percentile you compute becomes meaningless.
Instrumenting Plain Python With the traceable Decorator
The @traceable decorator turns any function into a run. Consequently, you can trace retrieval, reranking, post-processing, and business logic — not just the model call. The decorator captures arguments as inputs and the return value as outputs, and it nests automatically when decorated functions call each other.
import openai
from langsmith import traceable
from langsmith.wrappers import wrap_openai

# wrap_openai captures messages, tool calls, token usage, and
# model params without you writing any logging code.
client = wrap_openai(openai.Client())

@traceable(run_type="retriever", name="Search Knowledge Base")
def search_kb(query: str, top_k: int = 4) -> list[dict]:
    hits = vector_store.similarity_search_with_score(query, k=top_k)
    # Returning dicts with page_content lets LangSmith render
    # these as documents rather than an opaque blob.
    return [{"page_content": doc.page_content, "metadata": {"score": score}}
            for doc, score in hits]

@traceable(run_type="chain", name="Answer Question")
def answer_question(question: str, user_id: str) -> str:
    docs = search_kb(question)
    context = "\n\n".join(d["page_content"] for d in docs)

    completion = client.chat.completions.create(
        model="gpt-4o-mini",
        messages=[
            {"role": "system", "content": "Answer only from the given context."},
            {"role": "user", "content": f"Question: {question}\n\nContext:\n{context}"},
        ],
    )
    return completion.choices[0].message.content
Why this works: wrap_openai intercepts the client at the SDK boundary, so it records the exact serialized payload sent over the wire. As a result, you see the real assembled prompt rather than a template you hope was rendered correctly. Meanwhile, @traceable on search_kb makes the retrieval step a first-class child run, which is what lets you answer “did retrieval fail, or did the model ignore good context?”
The TypeScript API mirrors this closely, which helps if you run a Next.js frontend against a Python backend.
import OpenAI from "openai";
import { traceable } from "langsmith/traceable";
import { wrapOpenAI } from "langsmith/wrappers";

const client = wrapOpenAI(new OpenAI());

export const answerQuestion = traceable(
  async (question: string) => {
    const completion = await client.chat.completions.create({
      model: "gpt-4o-mini",
      messages: [{ role: "user", content: question }],
    });
    return completion.choices[0].message.content;
  },
  { name: "Answer Question", run_type: "chain" }
);
Adding Metadata That Makes Traces Searchable
A trace you cannot find is worthless. Therefore, attach metadata at the point where you know something useful: the user ID, the tenant, the prompt version, the model, the feature flag. Tags work well for low-cardinality labels, while metadata suits arbitrary key-value pairs.
import langsmith as ls

@traceable(run_type="chain", tags=["support-bot"])
def answer_question(question: str, user_id: str, prompt_version: str) -> str:
    # Set metadata dynamically once you know the routing decision.
    run = ls.get_current_run_tree()
    run.metadata["user_id"] = user_id
    run.metadata["prompt_version"] = prompt_version
    run.metadata["tenant"] = resolve_tenant(user_id)
    ...

# Or attach it at call time without touching the function body.
answer_question(
    "How do I reset my password?",
    user_id="u_8812",
    prompt_version="v7",
    langsmith_extra={"tags": ["experiment-b"], "metadata": {"channel": "web"}},
)
Always version your prompts and put that version in metadata. Later, when quality drops on a Tuesday afternoon, you can filter to prompt_version = v7 and compare score distributions against v6 in about thirty seconds. Without that field, you are guessing.
Debugging a Real RAG Failure With LangSmith Tracing
Consider a mid-sized internal documentation assistant — roughly a few thousand indexed pages, maintained by a small platform team. Users start reporting confidently wrong answers about the deployment runbook, but only sometimes. The failure does not reproduce locally, which is the usual shape of this problem.
Without tracing, the team would bisect prompts for a day. With tracing, the workflow is mechanical. First, filter the project to traces where a thumbs-down feedback score was recorded. Next, open one trace and expand the retriever run. Then compare the retrieved chunks against the question.
In cases like this, the trace typically reveals one of three root causes, and each looks completely different in the UI:
- Retrieval returned nothing relevant. The retriever run shows four chunks about an unrelated service. The bug lives in chunking or embeddings, not the prompt. Reviewing RAG chunking strategies is the fix path here.
- Retrieval was fine but the context got truncated. The retriever run looks healthy, yet the LLM run’s input prompt is visibly shorter than expected because a naive character-limit truncation cut the relevant chunk in half.
- Both were fine and the model ignored instructions. Retrieval and prompt look correct, so the problem is the system prompt or the model tier.
That third case is the one teams most often assume by default, and it is the one traces most often disprove. The trade-off worth naming: this level of visibility means production prompts and retrieved documents leave your infrastructure, which is a real constraint in regulated environments. The mitigation is covered below under input masking.
Do You Need LangChain to Use LangSmith?
No. LangSmith tracing works with any Python or TypeScript code through the @traceable decorator and the SDK wrappers, including raw OpenAI, Anthropic, or Vercel AI SDK calls. LangChain and LangGraph simply auto-instrument themselves, so you get traces without writing decorators at all.
That distinction matters when you are choosing an observability tool early. Teams frequently rule out LangSmith because they deliberately avoid LangChain, then rebuild a worse version of the same trace tree on top of OpenTelemetry spans. If you already run OTel, LangSmith can ingest OpenTelemetry traces, which is usually the better integration path than maintaining two instrumentation layers.
Tracing Agents Where the Loop Is the Bug
Agents fail differently from pipelines. A RAG chain has a fixed number of steps, so a bad answer maps to a specific stage. An agent, by contrast, decides its own control flow, which means the bug is often the sequence rather than any individual call. Traces are the only practical way to see that sequence.
Three patterns show up constantly in agent traces, and each has a distinct visual signature:
- The repeated tool call. The same tool run appears four or five times with nearly identical inputs. Usually the tool returned an unhelpful result, the model did not recognize it as terminal, and the loop kept retrying. Fix the tool’s error message, not the prompt.
- The premature stop. The agent produces a final answer after one tool call when it clearly needed three. The trace shows the model never requested the second tool, which points at tool descriptions being too vague to select.
- The context balloon. Each iteration’s LLM run has a visibly larger input than the last, because full tool outputs accumulate in message history. Token counts on each run make this obvious within seconds.
For that last pattern, sorting a project by total tokens descending surfaces the worst offenders immediately. Pair the finding with token counting and budget management to decide whether to summarize tool outputs or truncate history.
Filtering and Exporting Traces at Scale
Once you cross a few thousand traces per day, clicking through the UI stops scaling. LangSmith exposes a filter query language, and the same syntax works in the SDK. This matters for building dashboards and for pulling failure cohorts into notebooks.
from langsmith import Client

client = Client()

# Root runs only, in the last day, that errored or ran slowly.
slow_or_failed = client.list_runs(
    project_name="support-bot-prod",
    is_root=True,
    filter='or(eq(error, true), gt(latency, 8))',
)

# Find retriever runs that belong to traces the user rated badly.
# trace_filter applies to the root run; filter applies to the run you want back.
bad_retrievals = client.list_runs(
    project_name="support-bot-prod",
    filter='eq(name, "Search Knowledge Base")',
    trace_filter='and(eq(feedback_key, "user_score"), eq(feedback_score, 0))',
)

for run in bad_retrievals:
    print(run.inputs["query"], "->", len(run.outputs.get("output", [])))
Why this works: filter and trace_filter operate at different levels of the tree. Because of that split, you can ask for child runs conditioned on properties of the whole trace, which is the query you actually want when investigating quality regressions.
Closing the Loop With User Feedback
Traces alone tell you what happened. Feedback tells you whether it was good. Wiring a thumbs-up/thumbs-down control to create_feedback is the highest-leverage hour of work in this entire setup, because it converts an opaque trace pile into a labeled dataset.
from langsmith import Client
from langsmith.run_helpers import get_current_run_tree

client = Client()

@traceable(run_type="chain")
def handle_request(question: str) -> dict:
    run = get_current_run_tree()
    answer = answer_question(question)
    # Return the run id so the frontend can attach feedback later.
    return {"answer": answer, "trace_id": str(run.id)}

# Called from your /feedback endpoint when the user clicks a rating.
def record_rating(trace_id: str, score: int, comment: str | None = None):
    client.create_feedback(
        key="user_score",
        score=score,          # 1 for thumbs up, 0 for thumbs down
        trace_id=trace_id,
        comment=comment,
    )
Return the trace ID to the client, store it alongside the message in your own database, and send it back on rating. Subsequently, every complaint in your support queue becomes a one-click jump to the exact trace that caused it.
Turning Failing Traces Into an Eval Dataset
The real payoff of LangSmith tracing arrives when production failures stop being anecdotes and become regression tests. Because runs already contain structured inputs and outputs, promoting them to a dataset takes a few lines.
from langsmith import Client

client = Client()

failures = client.list_runs(
    project_name="support-bot-prod",
    is_root=True,
    trace_filter='and(eq(feedback_key, "user_score"), eq(feedback_score, 0))',
)

dataset = client.create_dataset(
    "support-bot-regressions",
    description="Production traces users rated as unhelpful.",
)

client.create_examples(
    dataset_id=dataset.id,
    examples=[{"inputs": run.inputs, "outputs": run.outputs} for run in failures],
)
After a human corrects the expected outputs, you can run experiments against that dataset on every prompt change.
def target(inputs: dict) -> dict:
    return {"answer": answer_question(inputs["question"], user_id="eval")}

def grounded_in_context(outputs: dict, reference_outputs: dict) -> bool:
    # Replace with an LLM-as-judge or a string/semantic check.
    return reference_outputs["answer"].lower() in outputs["answer"].lower()

results = client.evaluate(
    target,
    data="support-bot-regressions",
    evaluators=[grounded_in_context],
    experiment_prefix="prompt-v8",
)
For anything beyond boolean checks, have your LLM-as-judge return a structured score object rather than prose, so the evaluator stays deterministic to parse.
Controlling Cost, Volume, and Data Exposure
Tracing every request at full fidelity is rarely the right default at scale. Fortunately, three knobs cover most situations, and they are worth setting deliberately rather than discovering later.
| Concern | Mechanism | Typical setting |
|---|---|---|
| Trace volume | LANGSMITH_SAMPLING_RATE | 1.0 in staging, 0.1–0.3 in high-traffic production |
| Sensitive inputs | LANGSMITH_HIDE_INPUTS / LANGSMITH_HIDE_OUTPUTS | true for PII-heavy flows, with redaction upstream |
| Serverless truncation | client.flush() before return | Always, on Lambda and similar runtimes |
Sampling applies at the trace level, so you never get half a tree. However, keep error paths at full fidelity by tracing failures unconditionally in your exception handler — a 10% sample of successes plus 100% of errors is usually the right shape.
The serverless issue deserves emphasis. LangSmith batches runs on a background thread for performance, which is exactly wrong on AWS Lambda where the execution environment freezes the moment your handler returns. Therefore, flush explicitly.
from langsmith import Client

client = Client()

def lambda_handler(event, context):
    try:
        return {"statusCode": 200, "body": answer_question(event["question"], "u_1")}
    finally:
        # Without this, the last traces of each invocation silently vanish.
        client.flush()
For finer control over redaction, pass a callable to the client instead of hiding fields wholesale. That way you keep the trace shape while scrubbing the sensitive parts.
def scrub(inputs: dict) -> dict:
    return {k: ("<redacted>" if k in {"email", "ssn"} else v) for k, v in inputs.items()}

client = Client(hide_inputs=scrub)
LangSmith vs Langfuse vs Plain Logging
| Factor | LangSmith | Langfuse | Structured logging |
|---|---|---|---|
| Hosting | Cloud (US/EU), self-host on enterprise plan | Cloud or fully open-source self-host | Your existing stack |
| Framework coupling | Best-in-class for LangChain/LangGraph, SDK-agnostic otherwise | Framework-agnostic by design | None |
| Datasets and evals | Built in, tightly coupled to traces | Built in | Roll your own |
| Prompt management | Included with versioning | Included | Not applicable |
| Cost at high volume | Per-trace pricing, sampling recommended | Free when self-hosted, infra cost only | Cheapest |
Pick LangSmith when you are already in the LangChain ecosystem or when you want datasets, evals, and prompt versioning wired to traces without building glue. Choose Langfuse when self-hosting is non-negotiable for compliance or cost reasons. Plain structured logs remain defensible for a single LLM call behind a form, where a trace tree adds ceremony without insight.
When to Use LangSmith Tracing
- Your app chains three or more steps, such as retrieval, reranking, generation, and validation
- You run agents with tool calls, where failure modes hide in the middle of a loop
- Quality complaints arrive from users but do not reproduce locally
- You need per-request token and cost attribution across models or tenants
- You want production failures to become eval cases without manual transcription
- Multiple engineers ship prompt changes and you need to compare versions objectively
When NOT to Use LangSmith Tracing
- You make a single, stateless LLM call with a fixed prompt — request logs are enough
- Contractual or regulatory rules forbid prompt content leaving your infrastructure, and self-hosting is not available on your plan
- Your team already runs OpenTelemetry end-to-end and wants one pane of glass rather than a second one
- Traffic is very high and low-margin, where per-trace pricing outweighs the debugging benefit even with aggressive sampling
- You are prototyping locally for an afternoon and the console is faster
Common Mistakes with LangSmith Tracing
- Tracing only the LLM call. Without retriever and tool runs, you cannot tell bad context from a bad model, which is the single most valuable distinction a trace provides.
- Mixing environments in one project. Local runs skew production latency percentiles and error rates until the dashboards become decorative.
- Skipping metadata. A trace with no user ID, tenant, or prompt version cannot be correlated with a support ticket, so investigations start from scratch every time.
- Forgetting to flush in serverless. Traces batch in the background, and a frozen Lambda execution environment drops them silently — no error, just missing data.
- Logging raw PII by default. Set redaction before the first production deploy, not after a compliance review.
- Treating traces as the goal. Traces without feedback and datasets are just prettier logs. The loop only closes when failures become test cases.
- Sampling errors away. A uniform 10% sample discards 90% of your rarest and most valuable failures.
Conclusion and Next Steps
LangSmith tracing turns an opaque LLM pipeline into an inspectable tree, and the setup cost is genuinely small: two environment variables, one wrapped client, and a @traceable decorator on the steps that matter. Start by instrumenting one production path end-to-end, add a user feedback control that posts the trace ID back, and let a week of real traffic accumulate before you change anything. The failure patterns will be obvious once you can see them.
From there, promote your worst-rated traces into a dataset and run evaluate() on every prompt change so regressions get caught before users find them. If you are still designing the pipeline itself, start with RAG fundamentals built from scratch and LangChain fundamentals. For agent-shaped workloads, building AI agents with tools, planning, and execution pairs directly with what you will see in the trace tree.
2 Comments
Comments are closed.