If you’re running production workloads on AWS and lack visibility into failures, understanding AWS CloudWatch logging, metrics, and alarms is essential. This guide is for backend engineers, DevOps practitioners, and cloud-focused developers who want production-grade observability without introducing unnecessary complexity.
You’ll learn how CloudWatch logging works, how metrics are structured, how alarms should be configured, and most importantly, how to design alerting that surfaces real problems instead of noise.
By the end, you’ll be able to implement a monitoring strategy that scales with both your infrastructure and your team.
What Is AWS CloudWatch?
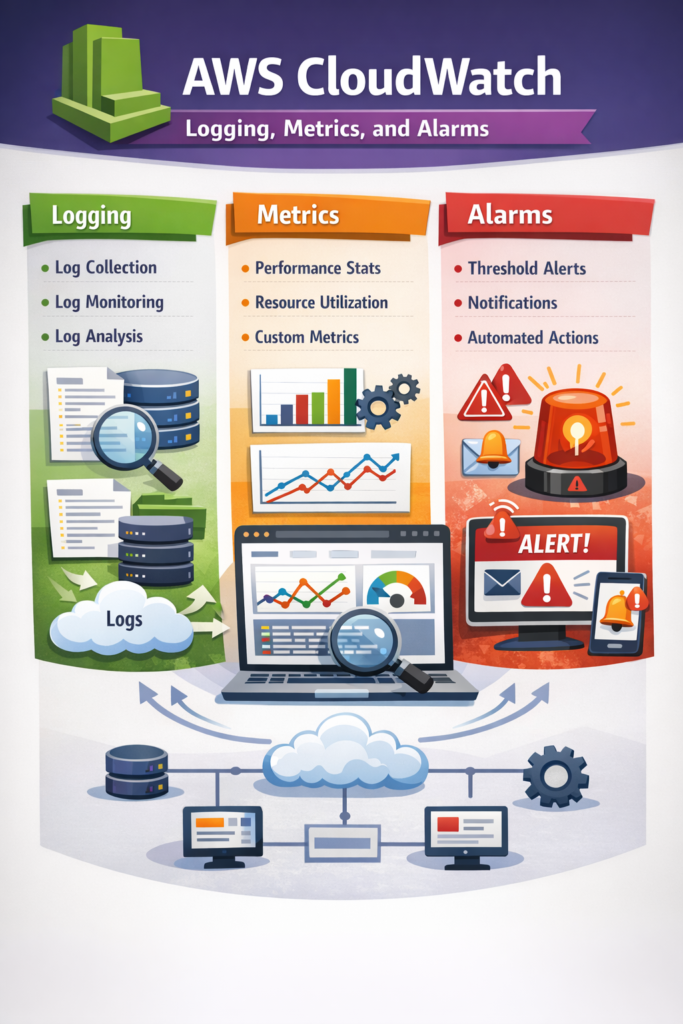
Amazon CloudWatch is AWS’s native observability platform. It collects and aggregates:
- Logs (application and infrastructure)
- Metrics (numeric time-series data)
- Events
- Alarms and notifications
Because it integrates directly with services like Amazon EC2, AWS Lambda, and Amazon RDS, it becomes the default monitoring layer for most AWS-native systems.
However, enabling CloudWatch is not the same as designing an effective monitoring strategy. Poor configuration leads to alert fatigue, missed incidents, and rising costs.
AWS CloudWatch Logging: Structured, Queryable, and Scalable
CloudWatch Logs stores log events inside:
- Log groups (typically per service or environment)
- Log streams (per instance, container, or Lambda invocation context)
A common production pattern is:
- One log group per microservice (e.g.,
orders-service-prod) - Structured JSON logging
- Explicit retention configuration
For example, a Lambda function automatically pushes logs to CloudWatch:
exports.handler = async (event) => {
  try {
    console.log(JSON.stringify({
      level: "INFO",
      message: "Processing order",
      orderId: event.orderId,
      timestamp: new Date().toISOString()
    }));

    return { status: "ok" };
  } catch (error) {
    console.error(JSON.stringify({
      level: "ERROR",
      message: error.message,
      stack: error.stack
    }));
    throw error;
  }
};
Why JSON? Because structured logs enable powerful queries using CloudWatch Logs Insights.
Example query:
fields @timestamp, level, message, orderId
| filter level = "ERROR"
| sort @timestamp desc
| limit 20
The query language supports parsing, filtering, aggregation, and time-based analysis. For syntax and advanced examples, review the official CloudWatch Logs Insights documentation.
Log Retention and Cost Strategy
By default, logs can be retained indefinitely. However, that often leads to escalating costs over time.
In practice:
- 7–14 days for high-volume application logs
- 30–90 days for security and audit logs
- Export to S3 for long-term archival if required
A common mistake is enabling logs everywhere but never reviewing retention policies. Consequently, costs grow silently.
If you’re designing backend systems that rely on structured APIs, similar to patterns discussed in GraphQL in React Native Using Apollo Client consistency in structured logging becomes critical for debugging distributed systems.
Metrics in AWS CloudWatch: Infrastructure vs Business Signals
Logs explain what happened. Metrics quantify how often and how severely it happens.
CloudWatch automatically publishes infrastructure metrics such as:
- CPUUtilization
- Memory metrics (with CloudWatch Agent)
- RequestCount
- NetworkIn / NetworkOut
However, infrastructure metrics alone rarely tell the full story.
Publishing Custom Metrics
Custom application metrics allow you to monitor business-level behavior.
Example using AWS SDK v3:
import { CloudWatchClient, PutMetricDataCommand } from "@aws-sdk/client-cloudwatch";

const client = new CloudWatchClient({ region: "us-east-1" });

async function publishOrderMetric() {
  await client.send(new PutMetricDataCommand({
    Namespace: "OrdersService",
    MetricData: [{
      MetricName: "OrdersProcessed",
      Value: 1,
      Unit: "Count"
    }]
  }));
}
Why publish custom metrics?
Because business failures are not always reflected in CPU or memory usage.
Examples of high-value custom metrics:
- PaymentTimeoutCount
- FailedOrders
- CacheMissRate
- ThirdPartyLatency
In production, a service may show healthy CPU and memory while returning 5XX errors due to a downstream dependency. Infrastructure metrics alone will not detect that.
For broader observability standards beyond AWS, consider the OpenTelemetry specification, which defines vendor-neutral metrics and tracing models.
Designing CloudWatch Alarms Without Creating Noise
Alarms monitor metrics and trigger actions when thresholds are breached. These actions may include:
- Sending notifications via SNS
- Triggering autoscaling
- Invoking Lambda functions
However, poorly designed alarms create alert fatigue.
Poor Alarm Configuration
- Static threshold (CPU > 60%)
- Single evaluation period
- No distinction between transient spikes and sustained failure
This approach triggers false positives during normal traffic peaks.
Improved Alarm Strategy
Instead:
- Monitor error rate percentages, not raw error counts
- Use percentile latency (p95 or p99)
- Require sustained breaches (e.g., 3 of 5 evaluation periods)
- Separate warning-level alarms from critical-level alarms
For example:
- Metric: HTTP 5XX Error Rate
- Threshold: > 2%
- Period: 1 minute
- Evaluation: 3 consecutive periods
This configuration reduces noise while preserving early detection.
For implementation details, refer to the official CloudWatch alarm configuration guide.
Real-World Scenario: Mid-Sized SaaS Platform
Consider a mid-sized SaaS application with:
- 5–8 microservices
- 20–30 API endpoints
- A small engineering team (3–5 developers)
- Biweekly production deployments
Initially, the team monitored only CPU and memory metrics.
Over several weeks, users reported intermittent checkout failures. Infrastructure dashboards appeared normal. However, structured logs revealed increasing payment provider timeouts.
The issue was not server capacity. It was third-party latency.
The team implemented:
- Custom metric:
PaymentTimeoutCount - Log-based metric filter for timeout patterns
- Alarm on payment error rate > 2% sustained for 3 minutes
As a result, incident detection time decreased significantly.
This scenario highlights an important trade-off:
Infrastructure metrics detect system strain.
Application metrics detect business failure.
Both are required.
If your mobile app communicates with backend services through platform integrations, observability becomes even more critical. For example, when implementing custom integrations as described in Writing Native Platform Channels in Flutter Plugins, backend failures must be surfaced clearly in logs and metrics. Otherwise, debugging cross-platform issues becomes significantly harder.
When building distributed client applications, such as those discussed in Developing React Native Apps for Wearables (e.g., smartwatches) resilience and partial failure handling become equally important on the client side.
Similarly, systems involving embedding pipelines or AI indexing, like those compared in Vector Databases Compared: Pinecone vs Weaviate vs Chroma require latency and ingestion metrics beyond infrastructure health.
Log-Based Metrics in CloudWatch
CloudWatch allows you to create metric filters based on log patterns.
Examples:
- Count occurrences of “ERROR”
- Count authentication failures
- Detect specific exception signatures
This bridges logging and metrics. However, high-cardinality patterns can increase cost.
Therefore, log-based metrics should target high-value events only.
When to Use AWS CloudWatch Logging, Metrics, and Alarms
- Your workloads run primarily inside AWS
- You need native integration with EC2, Lambda, or RDS
- Your team prefers managed observability
- You want built-in alerting without third-party systems
- You operate at small to medium scale
When NOT to Use AWS CloudWatch Logging, Metrics, and Alarms
- You require advanced distributed tracing across multiple clouds
- You operate extremely high log volumes with complex indexing needs
- You need deep analytics beyond Logs Insights capabilities
- You require unified observability across heterogeneous environments
Common Mistakes
- Monitoring infrastructure but not business metrics
- Using static thresholds without traffic baselining
- Keeping indefinite log retention
- Triggering alarms on single-period spikes
- Logging unstructured text instead of structured JSON
Conclusion
AWS CloudWatch logging, metrics, and alarms provide a powerful foundation for monitoring AWS-native systems. However, real observability requires deliberate design.
Start with business-critical metrics. Add structured logging. Then configure alarms that reflect real failure patterns, not momentary noise.
Monitoring is not a checkbox. It is a production design decision.
Moreover, production quality is not limited to backend observability. Just as backend systems require structured logging and alarms, frontend applications must handle failures gracefully. Principles like those discussed in Accessibility Best Practices for Flutter Apps ensure that users are not negatively impacted when services degrade or fail.