Self-hosting an LLM looks cheap on a whiteboard. An H100 rents for a few dollars an hour, an 8B model on it produces thousands of tokens a second, and the division makes per-token APIs look like a scam. In practice, the division leaves out three things: how busy the GPU actually is, what the cheapest API really charges, and which throughput figure you are dividing by.
This post is for the engineer deciding whether to move an open-weight model off a hosted API and onto rented GPUs, or explaining to finance why the move did not save what the spreadsheet promised. Every GPU rate and API price below was read from the vendor on 1 October 2026. Every throughput number comes from a published benchmark with its date and configuration. A PowerShell script near the end does all the arithmetic, so you can swap in your own prices and traffic.
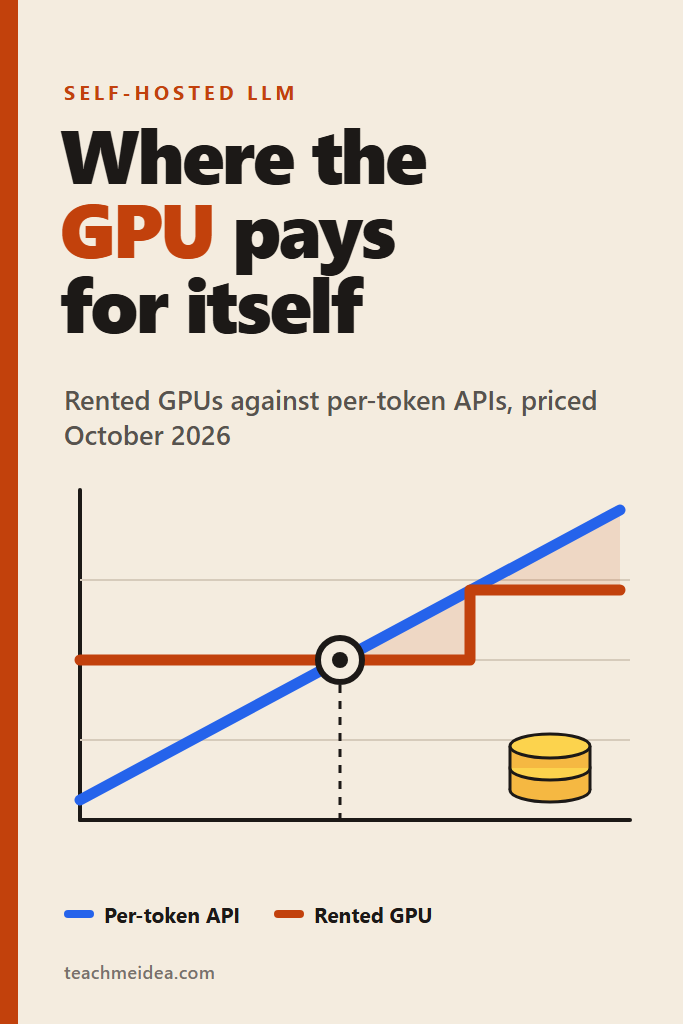
The short version is less friendly to self-hosting than most posts admit. Against the discount API tier, none of the twelve rental setups in this post ever breaks even, even at 100 percent utilization. Against mid-priced providers such as Together and Fireworks, self-hosting wins once the GPU stays busy between 19 and 86 percent of every hour, depending on the model and the cloud.
Where These Self-Hosting Prices Came From
Every rate came from the vendor’s own page or price file, read on the same day. Throughput figures are not measured here, because there was no GPU to measure on. Instead, they come from published benchmarks that state their hardware, precision, concurrency and token lengths.
Prices read 2026-10-01
AWS: EC2 on-demand and reserved price files, us-east-1, Linux,
     rate file published 2026-09-25T17:45:21Z
RunPod: runpod.io/pricing, Secure Cloud
Lambda: lambda.ai/pricing
Together AI: together.ai/pricing, serverless
Fireworks: docs.fireworks.ai/serverless/pricing
DeepInfra: deepinfra.com model pages and api.deepinfra.com/models
Throughput: NVIDIA NIM 1.8 performance tables (updated 2026-07-20),
            GPUStack Performance Lab, gpt-oss-120b on H100
Month length: 730 hours
The vendor pages are AWS EC2 on-demand pricing, RunPod pricing, Lambda pricing, Together AI pricing, Fireworks serverless pricing and DeepInfra pricing. Check any figure against them before committing budget.
Several costs are left out on purpose. Storage for model weights, network egress, load balancers, monitoring and engineering time all vary more by team than by vendor. As a result, every self-hosted figure below is a floor, and the real bill only goes up from there.
The Workload Being Priced
Three open-weight models, one request shape, and the throughput benchmarks that match them. Keeping the request shape fixed means every difference between rows comes from hardware, price or model size.
- Request shape: 1,000 input tokens and 1,000 output tokens, which matches the NIM benchmark configuration
- Small model: Llama 3.1 8B Instruct at FP8
- 70B-class model: Llama 3.3 70B Instruct at FP8, split across two H100s with tensor parallelism
- Large MoE model: gpt-oss-120b, which ships with MXFP4 weights and fits on one 80 GB GPU
- Concurrency: 100 simultaneous requests for the NIM rows, a level where per-user speed is still usable
These three were chosen because they have published throughput data on current GPUs. Newer releases such as Gemma 4 31B and DeepSeek V4 have API prices but no comparable benchmark from NVIDIA or MLPerf yet. Pricing a self-hosted model with an invented throughput would make the whole table fiction.
Is Self-Hosting an LLM Cheaper Than an API?
Self-hosting an LLM is cheaper than a mid-priced API only when the rented GPU stays busy for a large share of every hour, typically a fifth to most of it. Against the cheapest per-token providers, rented cloud GPUs did not break even for any model priced here. Utilization, not the hourly rate, decides the answer.
That answer surprises people, because the hourly rate is the number everyone quotes. However, a GPU bills for every hour it exists, while an API bills only for tokens you send. The comparison is therefore a fixed cost against a variable one, and the crossover depends entirely on volume.
Rate Card: Renting the GPUs
These are on-demand hourly rates for the hardware the benchmarks ran on. AWS prices come from its own published rate files, while the GPU clouds come from their pricing pages.
| Provider | Configuration | GPU | USD per hour |
|---|---|---|---|
| AWS | p5.4xlarge | 1x H100 80 GB | 6.88 |
| AWS | p5.4xlarge, 3-year reserved, no upfront | 1x H100 80 GB | 2.97216 |
| AWS | p5.48xlarge | 8x H100 80 GB | 55.04 |
| AWS | p5.48xlarge, 3-year reserved, no upfront | 8x H100 80 GB | 23.77728 |
| AWS | g6e.xlarge | 1x L40S 48 GB | 1.861 |
| AWS | g6e.xlarge, 3-year reserved, no upfront | 1x L40S 48 GB | 0.80395 |
| RunPod Secure Cloud | per GPU | H100 SXM 80 GB | 3.49 |
| RunPod Secure Cloud | per GPU | L40S 48 GB | 1.09 |
| Lambda | 8x H100 SXM, per GPU | H100 SXM 80 GB | 3.99 |
Two details in that table shape the 70B results. First, the AWS rate file lists the H100 only as a one-GPU p5.4xlarge or an eight-GPU p5.48xlarge, with nothing in between. A 70B model at FP8 needs two GPUs, so on AWS it means renting eight and running four copies. Second, AWS publishes no one-year reserved rate for p5 in us-east-1, only the three-year term.
Notably, RunPod’s Community Cloud lists the H100 SXM at 2.69 USD per hour, but those machines come from third-party hosts. The tables below use Secure Cloud, which is what a production service would run on.
Rate Card: Paying per Token
These are serverless per-token prices for the same three models. Prices are USD per million tokens.
| Model | Provider | Input | Output |
|---|---|---|---|
| Llama 3.1 8B | DeepInfra, Turbo FP8 | 0.02 | 0.04 |
| Llama 3.1 8B | Fireworks, 4B to 16B size tier | 0.20 | 0.20 |
| Llama 3.3 70B | DeepInfra, Turbo FP8 | 0.10 | 0.32 |
| Llama 3.3 70B | Fireworks, over 16B size tier | 0.90 | 0.90 |
| Llama 3.3 70B | Together AI | 1.04 | 1.04 |
| gpt-oss-120b | DeepInfra | 0.037 | 0.17 |
| gpt-oss-120b | Together AI, Fireworks, Groq | 0.15 | 0.60 |
The spread inside each model is the first real finding. For the same Llama 3.3 70B weights, Together charges about five times what DeepInfra does on a blended basis. Consequently, “what does the API cost” has no single answer, and a break-even calculated against the wrong provider is off by the same factor.
The DeepInfra Llama rows are FP8 quantized, which DeepInfra labels on each model page. That matches the precision of the self-hosted benchmarks below, so the comparison is fair on quality grounds. Fireworks lists named prices for some models and size-tier rates by parameter count for the rest, so its Llama rows are the published tier rate rather than a model-specific price.
Throughput Is the Number That Decides Everything
Throughput converts an hourly rate into a per-token cost, so it deserves more scrutiny than the price does. These are the figures used in every calculation below, all aggregate output tokens per second across concurrent requests.
| Model | Hardware | Engine | Concurrency | Output tok/s | Per-user speed |
|---|---|---|---|---|---|
| Llama 3.1 8B, FP8 | 1x H100 | NIM 1.8 | 100 | 9,392.43 | about 100 tok/s |
| Llama 3.1 8B, FP8 | 1x L40S | NIM 1.8 | 100 | 2,869.49 | about 29 tok/s |
| Llama 3.3 70B, FP8 | 2x H100, TP2 | NIM 1.8 | 100 | 2,895.49 | about 29 tok/s |
| gpt-oss-120b | 1x H100 | vLLM, default | 1,000 ShareGPT prompts | 2,901.05 | not reported |
The Llama rows come from the NIM Llama 3.1 8B performance table and the NIM Llama 3.3 70B performance table. NVIDIA defines the figure as “total output tokens divided by the end-to-end latency between the first request and the last response.” Per-user speed is derived from the table’s inter-token latency, 10.04 ms on the H100 and 34.1 ms on the L40S for the 8B model.
The gpt-oss row comes from the GPUStack gpt-oss-120b H100 benchmark, which reports 2,901.05 output tokens per second and 6,095.37 total for an unoptimized vLLM baseline. Since that run used real ShareGPT prompts, it carries about 1.1 input tokens per output token, and the API comparison bills input at that ratio.
Why Your Throughput Will Probably Be Lower
NIM is NVIDIA’s own tuned serving container, so its tables are close to a best case. For comparison, Red Hat’s MLPerf Inference v5.1 submission reports 5,777 tokens per second for Llama 3.1 8B on one H100 with vLLM, on a different workload. That gap is a reminder that the engine, the prompt mix and the settings can move throughput by a factor of two.
Moreover, throughput falls sharply as prompts get longer. In the same NIM table, the 8B model on an H100 drops to 3,180.16 output tokens per second at concurrency 100 when requests carry 5,000 input tokens and 500 output. A RAG workload with long retrieved context looks much more like that row than the 1,000 by 1,000 row used here. Therefore, every self-hosted cost in this post scales inversely with whatever throughput your traffic actually achieves.
Cost per Million Tokens at Full Utilization
Dividing each monthly rental by the output tokens it could produce in 730 hours gives the cheapest possible self-hosted price. These figures assume the GPU serves requests every second of the month, which no production service does.
| Model | Rental | USD per month | Capacity, M output tokens | USD per M output |
|---|---|---|---|---|
| 8B | 1x H100, AWS on-demand | 5,022.40 | 24,683 | 0.2035 |
| 8B | 1x H100, AWS 3-year reserved | 2,169.68 | 24,683 | 0.0879 |
| 8B | 1x H100, RunPod | 2,547.70 | 24,683 | 0.1032 |
| 8B | 1x L40S, AWS on-demand | 1,358.53 | 7,541 | 0.1802 |
| 8B | 1x L40S, AWS 3-year reserved | 586.88 | 7,541 | 0.0778 |
| 8B | 1x L40S, RunPod | 795.70 | 7,541 | 0.1055 |
| 70B | 8x H100, AWS on-demand | 40,179.20 | 30,437 | 1.3201 |
| 70B | 8x H100, AWS 3-year reserved | 17,357.41 | 30,437 | 0.5703 |
| 70B | 8x H100, Lambda | 23,301.60 | 30,437 | 0.7656 |
| 70B | 2x H100, RunPod | 5,095.40 | 7,609 | 0.6696 |
| 120B | 1x H100, AWS on-demand | 5,022.40 | 7,624 | 0.6588 |
| 120B | 1x H100, RunPod | 2,547.70 | 7,624 | 0.3342 |
Now compare that with the API side, where input tokens are billed alongside output at the workload’s ratio. DeepInfra charges 0.06 USD per million output tokens for the 8B model, 0.42 for the 70B and 0.2107 for gpt-oss-120b. Meanwhile, Fireworks and Together charge 0.40, 1.80 to 2.08, and 0.7652 respectively.
The best self-hosted 8B figure in the table is 0.0778 USD, on a three-year L40S reservation running flat out. DeepInfra’s 0.06 still beats it. Similarly, the best 70B figure is 0.5703, against DeepInfra’s 0.42, and the best gpt-oss figure is 0.3342, against 0.2107.
The Self-Hosting Break-Even Table
This is the table the rest of the post argues about. Each row shows how many million output tokens a month the rental must serve before it costs less than the API, and what share of the GPU’s full capacity that represents.
| Model | Rental | Against | Break-even, M output tokens/month | Utilization needed |
|---|---|---|---|---|
| 8B | 1x L40S, AWS 3-year reserved | Fireworks | 1,467 | 19% |
| 8B | 1x H100, AWS 3-year reserved | Fireworks | 5,424 | 22% |
| 8B | 1x L40S, RunPod | Fireworks | 1,989 | 26% |
| 8B | 1x H100, RunPod | Fireworks | 6,369 | 26% |
| 8B | 1x L40S, AWS on-demand | Fireworks | 3,396 | 45% |
| 8B | 1x H100, AWS on-demand | Fireworks | 12,556 | 51% |
| 70B | 8x H100, AWS 3-year reserved | Together | 8,345 | 27% |
| 70B | 2x H100, RunPod | Together | 2,450 | 32% |
| 70B | 2x H100, RunPod | Fireworks | 2,831 | 37% |
| 70B | 8x H100, Lambda | Together | 11,203 | 37% |
| 70B | 8x H100, AWS on-demand | Together | 19,317 | 63% |
| 70B | 8x H100, AWS on-demand | Fireworks | 22,322 | 73% |
| 120B | 1x H100, RunPod | Together, Fireworks | 3,330 | 44% |
| 120B | 1x H100, AWS on-demand | Together, Fireworks | 6,564 | 86% |
| any | any rental in this post | DeepInfra | above capacity | never |
Three patterns stand out. First, the cheap GPU clouds roughly halve the utilization needed compared with AWS on-demand, which is a bigger effect than the choice of model. Second, the L40S is the most forgiving card for an 8B model, because its low hourly rate outweighs its lower throughput. Third, nothing here beats the discount tier, so the break-even question only exists against mid-priced providers.
To put the volumes in request terms, 2,450 million output tokens at 1,000 tokens per response is about 2.45 million requests a month, or roughly one request per second around the clock. That is the point where two rented H100s start paying for themselves against Together for Llama 3.3 70B.
Why Nobody Runs a GPU at 100 Percent
The utilization column is where most self-hosting plans quietly fail. A GPU sized for peak traffic sits partly idle the rest of the day, and the arithmetic of that is unforgiving.
If your peak hour carries three times the average load and you provision for the peak, average utilization cannot exceed 33 percent. That alone rules out every AWS on-demand row in the table. Additionally, user-facing services need headroom above peak to keep latency stable, so the realistic ceiling is lower still.
Batch workloads are the exception. A nightly job that classifies, summarizes or embeds a backlog can keep a GPU saturated from start to finish and then release it. In that pattern, utilization approaches 100 percent for the hours you pay for, and the full-utilization table becomes the honest one. This is why offline pipelines are where self-hosting most often pays off.
Why the Discount APIs Win
The DeepInfra rows deserve an explanation, because they look impossible next to the rental costs. A provider serving thousands of customers on the same model keeps its GPUs far busier than any single tenant can, and it buys hardware on terms an individual renter never sees.
In other words, a shared API is a utilization pooling service. The provider absorbs your idle hours by filling them with someone else’s traffic. As a result, any single team renting the same GPU at retail prices starts at a structural disadvantage that no serving optimization fully closes.
That does not make discount providers the right choice for every workload. Rate limits, latency, data handling terms and model availability all differ, and a price that is low today can change. Nevertheless, the cheapest API is the baseline any self-hosting proposal has to beat, not the most expensive one.
Costs This Self-Hosting Comparison Leaves Out
A break-even table is only as honest as its gaps, and this one has several worth naming.
- Engineering time: none is priced. To include it, divide your monthly operations hours times your loaded hourly rate by the API price per million tokens, and add the result to the break-even volume.
- Storage and egress: AWS bills EBS volumes and internet egress separately, and RunPod charges 0.10 USD per GB-month for container and volume disk. A 70B model at FP8 needs around 70 GB of weights on disk.
- Redundancy: every row is a single replica. A production service usually needs at least two, which doubles the rental cost and the utilization required.
- Throughput source: none of these figures were measured for this post. The NIM tables are NVIDIA’s tuned containers, and the gpt-oss figure is a single third-party run.
- Missing hardware: no published benchmark covered the L4 or A100 at a comparable configuration, so those GPUs are left out rather than estimated.
- Serverless GPUs: Modal’s per-second GPU rates look attractive, but its pricing page lists “Non-preemptible execution” at “3x base prices,” which an always-on server would need.
A Team That Moved Off the API Too Early
Consider a mid-sized SaaS team, five or six engineers, running a support ticket summarizer on Llama 3.3 70B through Together. Over a few months, volume climbs to around 3,000 million output tokens a month, and the API invoice climbs to about 6,240 USD. Someone runs the full-utilization math, sees two rented H100s at 5,095.40 USD, and proposes the move.
On paper it saves money. In practice, the summarizer’s traffic follows business hours in two time zones, so peak load runs well above average. Two GPUs sized for the peak sit at roughly 39 percent average utilization, which is barely above the 32 percent break-even. After a second replica for failover, the self-hosted setup costs more than the API it replaced, before anyone counts the on-call time.
The cheaper move was available all along. The same 3,000 million output tokens on DeepInfra’s FP8 Llama 3.3 70B cost about 1,260 USD a month at the prices read for this post. The team needed to compare API providers before comparing APIs with GPUs, and a model gateway such as LiteLLM makes that switch a configuration change rather than a migration.
When Self-Hosting an LLM Pays Off
Run It Yourself for Saturated Batch Jobs
- Your workload is offline, such as nightly classification or bulk summarization, and can keep the GPU busy for every hour you rent it
- You can release the instance when the job ends, so idle hours never reach the bill
- Throughput matters more than per-request latency, which lets you push concurrency high
Choose Your Own GPUs for Data Control
- Contracts or regulation forbid sending prompts to a third-party inference provider
- You need a fine-tuned or merged model that no serverless provider hosts
- You need a model version pinned for years, independent of a provider’s deprecation schedule
Commit to Reserved Capacity at Steady Volume
- Traffic is flat enough that average utilization stays above the break-even in the table
- You can commit to a three-year reservation, which cuts the AWS H100 rate by more than half
- The team already operates GPU infrastructure, so the operations cost is incremental rather than new
When NOT to Self-Host an LLM
- A discount provider serves the same model at the same precision, because no rental in this post beats that tier
- Your traffic is user-facing and spiky, with a peak several times the daily average
- You would run a single replica with no failover to make the numbers work
- Nobody on the team has served models in production before, and the plan depends on matching NVIDIA’s benchmark throughput
- The real goal is a better model, since a hosted frontier model may solve the task in fewer tokens than any open-weight one
Common Mistakes with Self-Hosting an LLM
- Comparing rental costs with the most expensive API for a model instead of the cheapest one
- Using a vendor’s peak throughput figure when your prompts are several times longer than the benchmark’s
- Calculating cost per token at 100 percent utilization and never revisiting it with real traffic
- Forgetting that AWS sells the H100 only in one-GPU and eight-GPU sizes, which turns a two-GPU model into an eight-GPU bill
- Pricing one replica, then adding a second for availability after the budget is approved
- Treating serverless GPU base rates as the always-on price, when non-preemptible execution can triple them
How to Re-Run the Break-Even Numbers
Every table above comes from one PowerShell script, and it runs on Windows PowerShell 5.1 or PowerShell 7 with no modules. To adapt it, replace the throughput figures with your own measured numbers first, since they move every row, then update the prices.
# Prices read 2026-10-01. Throughput from published benchmarks, cited in the post.
$Hours = 730                                  # AWS monthly convention
$OssRatio = 6095.37 / 2901.05 - 1             # input per output token in the gpt-oss run

# size, name, USD/hour for the whole rental, output tok/s for that rental
$Setups = @(
  @('8B',   '1x H100, AWS p5.4xlarge',        6.88,     9392.43),
  @('8B',   '1x H100, AWS 3-yr reserved',     2.97216,  9392.43),
  @('8B',   '1x H100, RunPod Secure',         3.49,     9392.43),
  @('8B',   '1x L40S, AWS g6e.xlarge',        1.861,    2869.49),
  @('8B',   '1x L40S, AWS 3-yr reserved',     0.80395,  2869.49),
  @('8B',   '1x L40S, RunPod Secure',         1.09,     2869.49),
  @('70B',  '8x H100, AWS p5.48xlarge',       55.04,    (4 * 2895.49)),
  @('70B',  '8x H100, AWS 3-yr reserved',     23.77728, (4 * 2895.49)),
  @('70B',  '8x H100, Lambda',                (8 * 3.99), (4 * 2895.49)),
  @('70B',  '2x H100, RunPod Secure',         (2 * 3.49), 2895.49),
  @('120B', '1x H100, AWS p5.4xlarge',        6.88,     2901.05),
  @('120B', '1x H100, RunPod Secure',         3.49,     2901.05)
)

# USD per 1M input, per 1M output
$Apis = @{
  '8B'   = [ordered]@{ 'DeepInfra' = @(0.02, 0.04);  'Fireworks 4-16B tier' = @(0.20, 0.20) }
  '70B'  = [ordered]@{ 'DeepInfra' = @(0.10, 0.32);  'Fireworks >16B tier' = @(0.90, 0.90);
                       'Together' = @(1.04, 1.04) }
  '120B' = [ordered]@{ 'DeepInfra' = @(0.037, 0.17); 'Together, Fireworks' = @(0.15, 0.60) }
}

function Ratio($size) { if ($size -eq '120B') { $OssRatio } else { 1.0 } }

"Break-even, million output tokens per month"
"{0,-5}{1,-30}{2,-22}{3,10}{4,8}" -f '', 'rental', 'against', 'Mtok', 'util'
foreach ($s in $Setups) {
  $monthly = $s[2] * $Hours
  $cap = $s[3] * 3600 * $Hours / 1e6          # million output tokens per month
  foreach ($v in $Apis[$s[0]].Keys) {
    $p = $Apis[$s[0]][$v]
    $be = $monthly / ($p[0] * (Ratio $s[0]) + $p[1])
    $util = if ($be -le $cap) { '{0:P0}' -f ($be / $cap) } else { 'never' }
    "{0,-5}{1,-30}{2,-22}{3,10:N0}{4,8}" -f $s[0], $s[1], $v, $be, $util
  }
}
Break-even, million output tokens per month
     rental                        against                     Mtok    util
8B   1x H100, AWS p5.4xlarge       DeepInfra                 83,707   never
8B   1x H100, AWS p5.4xlarge       Fireworks 4-16B tier      12,556     51%
8B   1x H100, AWS 3-yr reserved    DeepInfra                 36,161   never
8B   1x H100, AWS 3-yr reserved    Fireworks 4-16B tier       5,424     22%
8B   1x H100, RunPod Secure        DeepInfra                 42,462   never
8B   1x H100, RunPod Secure        Fireworks 4-16B tier       6,369     26%
8B   1x L40S, AWS g6e.xlarge       DeepInfra                 22,642   never
8B   1x L40S, AWS g6e.xlarge       Fireworks 4-16B tier       3,396     45%
8B   1x L40S, AWS 3-yr reserved    DeepInfra                  9,781   never
8B   1x L40S, AWS 3-yr reserved    Fireworks 4-16B tier       1,467     19%
8B   1x L40S, RunPod Secure        DeepInfra                 13,262   never
8B   1x L40S, RunPod Secure        Fireworks 4-16B tier       1,989     26%
70B  8x H100, AWS p5.48xlarge      DeepInfra                 95,665   never
70B  8x H100, AWS p5.48xlarge      Fireworks >16B tier       22,322     73%
70B  8x H100, AWS p5.48xlarge      Together                  19,317     63%
70B  8x H100, AWS 3-yr reserved    DeepInfra                 41,327   never
70B  8x H100, AWS 3-yr reserved    Fireworks >16B tier        9,643     32%
70B  8x H100, AWS 3-yr reserved    Together                   8,345     27%
70B  8x H100, Lambda               DeepInfra                 55,480   never
70B  8x H100, Lambda               Fireworks >16B tier       12,945     43%
70B  8x H100, Lambda               Together                  11,203     37%
70B  2x H100, RunPod Secure        DeepInfra                 12,132   never
70B  2x H100, RunPod Secure        Fireworks >16B tier        2,831     37%
70B  2x H100, RunPod Secure        Together                   2,450     32%
120B 1x H100, AWS p5.4xlarge       DeepInfra                 23,832   never
120B 1x H100, AWS p5.4xlarge       Together, Fireworks        6,564     86%
120B 1x H100, RunPod Secure        DeepInfra                 12,089   never
120B 1x H100, RunPod Secure        Together, Fireworks        3,330     44%
Note the 4 * 2895.49 in the AWS and Lambda 70B rows. The eight-GPU box runs four independent two-GPU copies of the model, so it gets four times the throughput of one copy, which is how the per-token cost stays comparable with a two-GPU rental.
Conclusion: Price the Cheapest API Before the GPU
Self-hosting an LLM breaks even against mid-priced APIs once a rented GPU stays busy for roughly a fifth to most of every hour, and it never breaks even against the discount tier at the prices read for this post. The decision therefore rests on two numbers you can measure today: your real average utilization and the cheapest provider serving your model.
The practical next step is to pull a month of token counts from your logs, compute the average and peak load, and run them through the script above. If self-hosting still wins, serving models with vLLM covers the setup, and quantization with GGUF, AWQ and GPTQ explains how to fit a larger model on fewer GPUs. If it does not, LLM cost per task shows how to cut the API bill instead.
For the infrastructure side, the Lambda vs Fargate vs EC2 cost comparison applies the same fixed-versus-variable reasoning to ordinary compute, and Groq’s inference API is worth testing when speed matters more than price.
These prices will be re-read and this post updated within three months.