If your service saves a row and then tells the rest of the system about it, this post is for you. That covers an order service publishing OrderPlaced, a billing service emitting InvoicePaid, and any handler that writes to Postgres and then to Kafka, RabbitMQ or SQS. The transactional outbox pattern closes the gap between those two writes without two-phase commit. However, the pattern has its own failure modes, and they show up in a fairly predictable order as a system grows. This guide walks through seven of them, from the dual write that loses events to a replication slot that fills the disk. For each one you get the code that causes it, the fix, and a test run against a real Postgres instance.
Every number below comes from scripts run on the machine listed here. Each script appears in full, so you can run it yourself and compare.
Measured 2026-10-23
Windows 11 Pro (build 26200), AMD Ryzen 5 8600G, 15 GB
PostgreSQL 18.6 (EDB Windows x64 binaries), local, default settings plus wal_level=logical
Node.js 24.22.1 (official win-x64 zip, SHA-256 checked), node-postgres (pg) 8.23.1
crash.mjs: 3 runs of 50 kills per mode. cursor.mjs, two-relays.mjs, relay-crash.mjs: 3 runs each.
Relay query EXPLAIN: 3 runs per index setting. Replication slot test: 1 run.
Every run is shown.
Debezium docs read the same day: 3.7.0.Final is the latest stable release (2026-09-29).
What Is the Transactional Outbox Pattern?
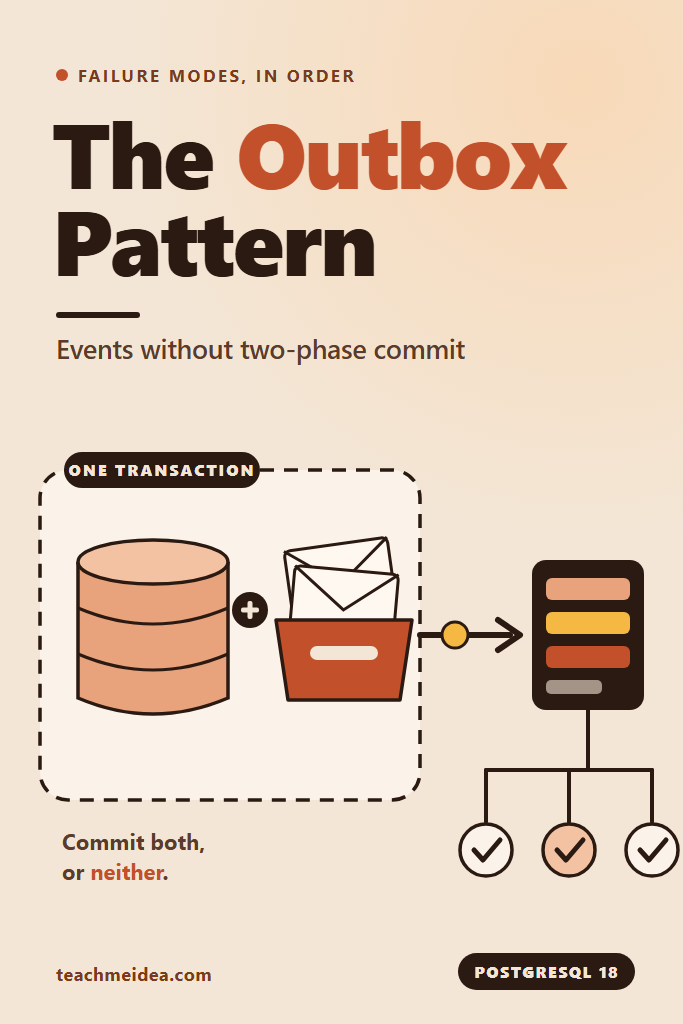
The transactional outbox pattern writes an event into an outbox table in the same database transaction as the business change. A separate relay then reads committed outbox rows and publishes them to the message broker. Because both rows commit or roll back together, an event exists if and only if the change it describes exists.
The idea is old and well documented, notably in Chris Richardson’s transactional outbox pattern description. What the pattern does not do is make delivery exactly-once. Instead, it turns “maybe lost” into “at least once”, and the rest of this post is mostly about what that trade costs in practice.
Why Not Two-Phase Commit?
Two-phase commit coordinates a database and a broker so both commit or neither does. In theory, that solves the dual write directly. In practice, it is rarely available and rarely worth it.
First, the broker has to take part. Kafka transactions cover writes to Kafka topics and consumer offsets, as described in KIP-98, but Kafka cannot join an XA transaction alongside Postgres. Similarly, SQS has no transaction coordinator at all. Second, Postgres ships with max_prepared_transactions set to 0, so PREPARE TRANSACTION is off by default. Turning it on means a coordinator crash can leave prepared transactions holding locks until someone resolves them by hand.
The outbox avoids all of that. It needs one local transaction, which every relational database already does well. As a result, the coordination problem becomes a polling or streaming problem, and those are much easier to operate.
Transactional Outbox Pattern Failure Modes: Quick Reference
| Stage | Failure mode | What you see | Fix |
|---|---|---|---|
| 1 | Dual write instead of an outbox | Orders with no event, or events with no order | Write the event row in the business transaction |
| 2 | Relay reads by id cursor | Events silently never published | Claim rows by state, not by position |
| 3 | Two relays without row locks | Every event published twice | FOR UPDATE SKIP LOCKED |
| 4 | SKIP LOCKED without partitioning | Events of one aggregate arrive out of order | One relay per aggregate partition |
| 5 | Assuming exactly-once delivery | Duplicate side effects after relay restarts | Idempotent consumers keyed on event id |
| 6 | Outbox never cleaned up | Relay query slows from microseconds to milliseconds | Partial index plus batched cleanup |
| 7 | CDC with an unwatched slot | Disk fills with WAL while the connector is down | max_slot_wal_keep_size and slot alerts |
The Test Setup
The tests share one schema, a small client library, and a stand-in broker. That broker is a plain HTTP server that records events in arrival order. Consequently, every test can count lost, duplicated and reordered events exactly, which a real Kafka cluster would make harder to read.
-- schema.sql
DROP TABLE IF EXISTS orders, outbox;

CREATE TABLE orders (
  id          bigserial PRIMARY KEY,
  customer_id bigint      NOT NULL,
  total_cents integer     NOT NULL,
  created_at  timestamptz NOT NULL DEFAULT now()
);

CREATE TABLE outbox (
  id             bigserial PRIMARY KEY,
  aggregate_type text        NOT NULL,
  aggregate_id   text        NOT NULL,
  event_type     text        NOT NULL,
  payload        jsonb       NOT NULL,
  created_at     timestamptz NOT NULL DEFAULT now(),
  published_at   timestamptz
);

-- The relay only ever looks for unpublished rows, so index only those
CREATE INDEX outbox_unpublished_idx ON outbox (id) WHERE published_at IS NULL;
// lib.mjs: shared connection settings and the stand-in broker client
import pg from 'pg';

export const DB_URL = process.env.DB_URL ?? 'postgres://postgres@127.0.0.1:55432/outbox';
export const BROKER = process.env.BROKER ?? 'http://127.0.0.1:4100';

export async function connect() {
  const client = new pg.Client({ connectionString: DB_URL });
  await client.connect();
  return client;
}

export async function publish(event) {
  const res = await fetch(`${BROKER}/publish`, {
    method: 'POST',
    headers: { 'content-type': 'application/json' },
    body: JSON.stringify(event),
  });
  if (!res.ok) throw new Error(`broker returned ${res.status}`);
}

export async function brokerEvents() {
  return (await fetch(`${BROKER}/events`)).json();
}

export async function resetBroker() {
  await fetch(`${BROKER}/events`, { method: 'DELETE' });
}

export const sleep = (ms) => new Promise((r) => setTimeout(r, ms));
// broker.mjs: a stand-in message broker. Accepts POST /publish and keeps events in arrival order.
import http from 'node:http';

let events = [];

http
  .createServer(async (req, res) => {
    if (req.method === 'POST' && req.url === '/publish') {
      let body = '';
      for await (const chunk of req) body += chunk;
      events.push(JSON.parse(body));
      res.writeHead(204).end();
    } else if (req.method === 'DELETE' && req.url === '/events') {
      events = [];
      res.writeHead(204).end();
    } else if (req.url === '/events') {
      res.writeHead(200, { 'content-type': 'application/json' }).end(JSON.stringify(events));
    } else {
      res.writeHead(404).end();
    }
  })
  .listen(4100, '127.0.0.1', () => console.log('broker listening on 4100'));
Postgres ran from the EDB binaries zip in a scratch directory. The commands below start it on a spare port, so nothing touches an existing install.
initdb -D pgdata -U postgres -A trust -E UTF8 --locale=C
pg_ctl -D pgdata -o "-p 55432 -c wal_level=logical" -l pg.log start
psql -p 55432 -U postgres -c "CREATE DATABASE outbox"
npm install pg
node broker.mjs &
Stage 1: The Dual Write That Loses Events
The first failure is not using an outbox at all. The handler commits the order and then publishes the event. Usually both succeed, so the code passes every test. The trouble starts when the process dies between the two calls, which happens on every deploy, every OOM kill and every node eviction.
Killing the Writer 150 Times
The writer below places orders in a loop. It has three modes: commit then publish, publish inside the transaction, and the outbox.
// writer.mjs: places orders in a loop until killed.
// Usage: node writer.mjs dual|dual-inside|outbox
import { connect, publish } from './lib.mjs';

const mode = process.argv[2];
const db = await connect();

for (;;) {
  const customerId = 1 + Math.floor(Math.random() * 1000);
  const totalCents = 500 + Math.floor(Math.random() * 20000);

  await db.query('BEGIN');
  const { rows } = await db.query(
    'INSERT INTO orders (customer_id, total_cents) VALUES ($1, $2) RETURNING id',
    [customerId, totalCents],
  );
  const event = { type: 'OrderPlaced', orderId: Number(rows[0].id), customerId, totalCents };

  if (mode === 'dual') {
    await db.query('COMMIT');
    await publish(event); // a crash here loses the event
  } else if (mode === 'dual-inside') {
    await publish(event); // a crash after this line publishes an order that never exists
    await db.query('COMMIT');
  } else {
    // outbox: the event row commits or rolls back together with the order
    await db.query(
      `INSERT INTO outbox (aggregate_type, aggregate_id, event_type, payload)
       VALUES ('order', $1, 'OrderPlaced', $2)`,
      [String(event.orderId), event],
    );
    await db.query('COMMIT');
  }
}
The harness starts the writer, hard-kills it after a random 200 to 1,000 ms, and repeats. On Windows, SIGKILL maps to TerminateProcess, so no cleanup code runs, which matches a real crash. Afterwards, it compares the orders table with what the broker received.
// crash.mjs: runs writer.mjs, hard-kills it at a random moment, repeats, then compares
// the orders table with what the broker received.
// Usage: node crash.mjs dual|dual-inside|outbox <kills>
import { spawn } from 'node:child_process';
import { once } from 'node:events';
import { readFileSync } from 'node:fs';
import { connect, brokerEvents, resetBroker, sleep } from './lib.mjs';

const [mode, kills = '50'] = process.argv.slice(2);
const db = await connect();
await db.query(readFileSync('schema.sql', 'utf8'));
await resetBroker();

for (let i = 0; i < Number(kills); i++) {
  const writer = spawn(process.execPath, ['writer.mjs', mode], { stdio: 'inherit' });
  await sleep(200 + Math.random() * 800);
  writer.kill('SIGKILL'); // TerminateProcess on Windows: no cleanup, no finally blocks
  await once(writer, 'exit');
}

if (mode === 'outbox') {
  const relay = spawn(process.execPath, ['relay.mjs', '--drain'], { stdio: 'inherit' });
  await once(relay, 'exit');
}

await sleep(500); // let Postgres finish rolling back the killed sessions
const orderIds = new Set((await db.query('SELECT id FROM orders')).rows.map((r) => Number(r.id)));
const events = await brokerEvents();
const eventIds = events.map((e) => e.orderId);
const uniqueEventIds = new Set(eventIds);

const lost = [...orderIds].filter((id) => !uniqueEventIds.has(id)).length;
const phantom = [...uniqueEventIds].filter((id) => !orderIds.has(id)).length;
console.log(
  `mode=${mode.padEnd(11)} kills=${kills} orders=${orderIds.size} events=${events.length} ` +
    `lost=${lost} phantom=${phantom} duplicates=${eventIds.length - uniqueEventIds.size}`,
);
await db.end();
for m in dual dual-inside outbox; do for i in 1 2 3; do node crash.mjs $m 50; done; done
mode=dual        kills=50 orders=45357 events=45331 lost=26 phantom=0 duplicates=0
mode=dual        kills=50 orders=44752 events=44737 lost=15 phantom=0 duplicates=0
mode=dual        kills=50 orders=45772 events=45754 lost=18 phantom=0 duplicates=0
mode=dual-inside kills=50 orders=49017 events=49023 lost=0 phantom=6 duplicates=0
mode=dual-inside kills=50 orders=47418 events=47430 lost=0 phantom=12 duplicates=0
mode=dual-inside kills=50 orders=43069 events=43079 lost=0 phantom=10 duplicates=0
mode=outbox      kills=50 orders=68774 events=68774 lost=0 phantom=0 duplicates=0
mode=outbox      kills=50 orders=54294 events=54294 lost=0 phantom=0 duplicates=0
mode=outbox      kills=50 orders=64802 events=64802 lost=0 phantom=0 duplicates=0
The commit-then-publish writer lost 15 to 26 events per 50 kills. In other words, roughly 30 to 50 percent of crashes landed in the gap between COMMIT and the publish call. Each lost event is an order that downstream services will never hear about: no confirmation email, no stock reservation, no invoice.
Note that the order totals differ between modes because the kill times are random. They are not a throughput comparison.
Publishing Inside the Transaction Trades Lost Events for Phantom Ones
The common first fix is to publish before committing. That removes lost events, and the dual-inside runs confirm it with zero lost. However, it produced 6 to 12 phantom events per 50 kills instead. The broker received OrderPlaced for an order that rolled back when the process died, so consumers now act on an order that does not exist.
Moreover, this version holds the database transaction open for the whole broker round trip. A slow broker therefore turns into long-held row locks and a full connection pool, which is the failure described in the Postgres connection limit failure modes post.
The Fix: One Transaction, Two Rows
The outbox mode wrote the event as a row in the same transaction, and a relay published it afterwards. Across 150 kills it lost nothing and produced no phantoms. The guarantee comes from Postgres, not from the timing: the order and its event commit or roll back together. If you need a refresher on what a transaction does and does not promise, the guide to database transactions and isolation levels covers it.
Stage 2: A Relay Cursor That Skips Late Commits
Once the outbox exists, someone writes the relay. The obvious design tracks the highest id it has published and polls for id > last_seen_id. It looks efficient, and it never touches the rows. Unfortunately, it silently skips events under concurrent writes.
Why Sequence Order Is Not Commit Order
A bigserial id is assigned when the row is inserted, but the row becomes visible when its transaction commits. So transaction A can take id 101, transaction B can take id 102 and commit first, and the relay can read 102 and move its cursor past 101. When A commits a moment later, its row sits below the cursor forever. The sequence functions documentation describes the same property from the other side: sequence values are handed out outside the transaction.
Eight Writers, One Cursor, Three Runs
The script below runs eight writers for ten seconds. Each holds its transaction open for a random 0 to 20 ms after inserting, standing in for the rest of the business logic. One relay polls every 5 ms, either by cursor or by claiming unpublished rows.
// cursor.mjs: eight concurrent writers, one relay, ten seconds.
// "cursor" polls WHERE id > last_seen_id. "claim" polls WHERE published_at IS NULL.
// Usage: node cursor.mjs cursor|claim [seconds]
import { readFileSync } from 'node:fs';
import { connect, sleep } from './lib.mjs';

const [mode, seconds = '10'] = process.argv.slice(2);
const admin = await connect();
await admin.query(readFileSync('schema.sql', 'utf8'));

let running = true;
const seen = new Set();

async function writer() {
  const db = await connect();
  while (running) {
    await db.query('BEGIN');
    await db.query(
      `INSERT INTO outbox (aggregate_type, aggregate_id, event_type, payload)
       VALUES ('order', '1', 'OrderPlaced', '{}')`,
    );
    await sleep(Math.random() * 20); // the rest of the business transaction
    await db.query('COMMIT');
  }
  await db.end();
}

async function relay() {
  const db = await connect();
  let cursor = 0;
  while (running || Date.now() < drainUntil) {
    if (mode === 'cursor') {
      const { rows } = await db.query(
        'SELECT id FROM outbox WHERE id > $1 ORDER BY id LIMIT 1000',
        [cursor],
      );
      for (const r of rows) seen.add(Number(r.id));
      if (rows.length) cursor = Number(rows.at(-1).id);
    } else {
      await db.query('BEGIN');
      const { rows } = await db.query(
        `SELECT id FROM outbox WHERE published_at IS NULL
          ORDER BY id LIMIT 1000 FOR UPDATE SKIP LOCKED`,
      );
      for (const r of rows) seen.add(Number(r.id));
      await db.query('UPDATE outbox SET published_at = now() WHERE id = ANY($1)', [rows.map((r) => r.id)]);
      await db.query('COMMIT');
    }
    await sleep(5);
  }
  await db.end();
}

let drainUntil = Infinity;
const writers = Array.from({ length: 8 }, writer);
const relayDone = relay();
await sleep(Number(seconds) * 1000);
running = false;
await Promise.all(writers);
drainUntil = Date.now() + 2000; // two more seconds of polling after the last commit
await relayDone;

const { rows } = await admin.query('SELECT id FROM outbox');
const missed = rows.filter((r) => !seen.has(Number(r.id))).length;
console.log(`mode=${mode.padEnd(6)} committed=${rows.length} relayed=${seen.size} never_relayed=${missed}`);
await admin.end();
for m in cursor claim; do for i in 1 2 3; do node cursor.mjs $m; done; done
mode=cursor committed=4420 relayed=3190 never_relayed=1230
mode=cursor committed=4495 relayed=3164 never_relayed=1331
mode=cursor committed=4471 relayed=3154 never_relayed=1317
mode=claim  committed=4622 relayed=4622 never_relayed=0
mode=claim  committed=4569 relayed=4569 never_relayed=0
mode=claim  committed=4634 relayed=4634 never_relayed=0
The cursor relay never saw 1,230 to 1,331 committed events per run, roughly 28 to 30 percent. Furthermore, it would never see them, because the cursor only moves forward. The rate here is high because every transaction stays open for up to 20 ms after taking its id. With shorter transactions the skip rate drops, but it never reaches zero, and a lower rate is worse in one way: it hides in testing.
Claim Rows by State, Not by Position
The claim relay asks a different question: which rows are still unpublished? It missed nothing, because a row that commits late is still unpublished when it appears. The partial index from the schema keeps that query cheap, which Stage 6 measures.
If you must use a cursor, for example when reading a table you cannot update, the usual workaround is to stay a safety margin behind the newest id or the newest commit time. That shrinks the window but cannot close it, so treat it as a last resort.
Stage 3: Two Relays Publishing the Same Rows
The relay works, so it gets deployed inside the service. Then the service scales to two replicas, and now two relays poll the same table. Without row locks, both read the same unpublished rows, both publish them, and both mark them published.
Running Two Relays at Once
The test seeds 5,000 events across 20 accounts, inserted in shuffled order so ids interleave between accounts. Each event carries a seq number that rises within its account. Two relays then drain the table in three configurations.
// seed.mjs: 20 aggregates x 250 events, inserted in shuffled order so ids interleave
import { readFileSync } from 'node:fs';
import { connect } from './lib.mjs';

export async function seed(aggregates = 20, perAggregate = 250) {
  const db = await connect();
  await db.query(readFileSync('schema.sql', 'utf8'));
  const next = new Array(aggregates).fill(1);
  const pending = [];
  for (let a = 0; a < aggregates; a++) for (let i = 0; i < perAggregate; i++) pending.push(a);
  pending.sort(() => Math.random() - 0.5);
  // Sequence numbers rise in id order within each aggregate, the order consumers must see
  const rows = pending.map((a) => ({ aggregateId: `acct-${a}`, seq: next[a]++ }));
  await db.query(
    `INSERT INTO outbox (aggregate_type, aggregate_id, event_type, payload)
     SELECT 'account', r->>'aggregateId', 'BalanceChanged', r
       FROM jsonb_array_elements($1::jsonb) WITH ORDINALITY AS t(r, n) ORDER BY n`,
    [JSON.stringify(rows)],
  );
  await db.end();
}
// two-relays.mjs: two relay instances drain the same outbox at once.
// Usage: node two-relays.mjs naive|skip-locked|partitioned
import { spawn } from 'node:child_process';
import { once } from 'node:events';
import { connect, publish, brokerEvents, resetBroker } from './lib.mjs';
import { seed } from './seed.mjs';

const mode = process.argv[2];

// naive: read unpublished rows without locking them, publish, then mark
async function naiveRelay() {
  const db = await connect();
  for (;;) {
    const { rows } = await db.query(
      'SELECT id, payload FROM outbox WHERE published_at IS NULL ORDER BY id LIMIT 100',
    );
    if (rows.length === 0) break;
    for (const row of rows) await publish({ eventId: Number(row.id), ...row.payload });
    await db.query('UPDATE outbox SET published_at = now() WHERE id = ANY($1)', [rows.map((r) => r.id)]);
  }
  await db.end();
}

function relayProcess(...args) {
  const child = spawn(process.execPath, ['relay.mjs', '--drain', ...args], { stdio: 'inherit' });
  return once(child, 'exit');
}

await seed();
await resetBroker();

if (mode === 'naive') await Promise.all([naiveRelay(), naiveRelay()]);
if (mode === 'skip-locked') await Promise.all([relayProcess(), relayProcess()]);
if (mode === 'partitioned') {
  await Promise.all([relayProcess('--partition', '0/2'), relayProcess('--partition', '1/2')]);
}

const events = await brokerEvents();
const unique = new Set(events.map((e) => e.eventId));
// An inversion: an event arrives after a later event of the same aggregate already arrived
const highest = new Map();
let inversions = 0;
for (const e of events) {
  if (e.seq < (highest.get(e.aggregateId) ?? 0)) inversions++;
  highest.set(e.aggregateId, Math.max(e.seq, highest.get(e.aggregateId) ?? 0));
}
const [{ count }] = (await (await connect()).query('SELECT count(*)::int FROM outbox')).rows;
console.log(
  `mode=${mode.padEnd(11)} outbox_rows=${count} delivered=${events.length} ` +
    `duplicates=${events.length - unique.size} out_of_order=${inversions}`,
);
process.exit(0);
for m in naive skip-locked partitioned; do for i in 1 2 3; do node two-relays.mjs $m; done; done
mode=naive       outbox_rows=5000 delivered=10000 duplicates=5000 out_of_order=239
mode=naive       outbox_rows=5000 delivered=10000 duplicates=5000 out_of_order=355
mode=naive       outbox_rows=5000 delivered=10000 duplicates=5000 out_of_order=360
mode=skip-locked outbox_rows=5000 delivered=5000 duplicates=0 out_of_order=1995
mode=skip-locked outbox_rows=5000 delivered=5000 duplicates=0 out_of_order=1905
mode=skip-locked outbox_rows=5000 delivered=5000 duplicates=0 out_of_order=1479
mode=partitioned outbox_rows=5000 delivered=5000 duplicates=0 out_of_order=0
mode=partitioned outbox_rows=5000 delivered=5000 duplicates=0 out_of_order=0
mode=partitioned outbox_rows=5000 delivered=5000 duplicates=0 out_of_order=0
The naive relays published every one of the 5,000 events twice, in all three runs. Both relays read the same batch, so they stayed in lockstep for the entire drain. Note that the naive out_of_order count includes second copies arriving after newer events, so it overlaps with the duplicates.
Adding FOR UPDATE SKIP LOCKED fixed duplication completely. A second relay now skips rows the first one holds, as the PostgreSQL locking clause documentation describes. However, the same runs show the next problem.
Stage 4: SKIP LOCKED Breaks Per-Aggregate Order
With SKIP LOCKED, relay A claims one batch and relay B claims the next. Both publish at the same time, so an account’s event with seq 41 can reach the broker after its event with seq 42. The test counted 1,479 to 1,995 such late arrivals out of 5,000 events. In other words, roughly 30 to 40 percent of events arrived after a newer event for the same account.
For many events, order does not matter. For a balance, a status machine or a “latest value wins” read model, it decides whether the data is correct. The event-driven microservices with Kafka guide explains why Kafka keys exist for exactly this reason, but a key only preserves order that the producer already respected.
A Relay Worth Copying
The partitioned runs fixed both problems: zero duplicates and zero reordering. Each relay owns a fixed share of aggregates, chosen by hashing aggregate_id, and it publishes its share in id order. SKIP LOCKED stays in place as protection if two relays are ever configured with the same partition.
// relay.mjs: claims unpublished outbox rows, publishes them, marks them published.
// Usage: node relay.mjs [--drain] [--partition i/n] [--batch 100]
import { parseArgs } from 'node:util';
import { connect, publish, sleep } from './lib.mjs';

const { values: opts } = parseArgs({
  options: {
    drain: { type: 'boolean', default: false },
    partition: { type: 'string', default: '0/1' },
    batch: { type: 'string', default: '100' },
  },
});
const [part, parts] = opts.partition.split('/').map(Number);
const batch = Number(opts.batch);

const db = await connect();

for (;;) {
  await db.query('BEGIN');
  // SKIP LOCKED: a second relay skips rows this one holds instead of waiting or re-reading them.
  // The partition filter keeps every event of one aggregate on one relay, which keeps its order.
  const { rows } = await db.query(
    `SELECT id, aggregate_id, event_type, payload
       FROM outbox
      WHERE published_at IS NULL
        AND abs(hashtext(aggregate_id)) % $2 = $1
      ORDER BY id
      LIMIT $3
      FOR UPDATE SKIP LOCKED`,
    [part, parts, batch],
  );

  for (const row of rows) {
    await publish({ eventId: Number(row.id), ...row.payload }); // eventId lets consumers dedupe
  }
  if (rows.length > 0) {
    await db.query('UPDATE outbox SET published_at = now() WHERE id = ANY($1)', [rows.map((r) => r.id)]);
  }
  await db.query('COMMIT');

  if (rows.length === 0) {
    if (opts.drain) break;
    await sleep(50); // idle poll interval
  }
}
await db.end();
Why this works: a single aggregate always hashes to the same relay, and one relay never runs two batches at once. Therefore the order inside an aggregate is the id order, which is the commit order for that aggregate when the business logic locks the aggregate row before writing.
The trade-off is that partitions are static. If one relay dies, its share waits until it restarts or until another instance takes over that partition. In practice, teams run the relay as a small deployment with one replica per partition and let the orchestrator restart it, or they use a Postgres advisory lock per partition so a standby instance can take over.
Stage 5: Treating the Relay as Exactly-Once
The relay publishes a batch, then marks it published, then commits. If it dies after publishing and before committing, the marks roll back and the next run publishes those rows again. That is not a bug in the relay. It is the contract: the transactional outbox pattern delivers at least once.
Killing the Relay Mid-Batch
The test below seeds 5,000 events, then starts the relay and hard-kills it after 100 to 400 ms, repeating until the outbox is empty. Afterwards it feeds every delivered event through an idempotent consumer.
// consumer.mjs: applies one event, skipping it if this event id was already processed
export async function handle(db, event) {
  await db.query('BEGIN');
  try {
    const { rowCount } = await db.query(
      'INSERT INTO processed_events (event_id) VALUES ($1) ON CONFLICT DO NOTHING',
      [event.eventId],
    );
    if (rowCount === 0) {
      await db.query('ROLLBACK'); // seen before: a redelivery, not a new fact
      return false;
    }
    await db.query('INSERT INTO ledger (account_id, seq) VALUES ($1, $2)', [event.aggregateId, event.seq]);
    await db.query('COMMIT');
    return true;
  } catch (err) {
    await db.query('ROLLBACK');
    throw err;
  }
}
-- consumer.sql
DROP TABLE IF EXISTS processed_events, ledger;
CREATE TABLE processed_events (
  event_id     bigint PRIMARY KEY,
  processed_at timestamptz NOT NULL DEFAULT now()
);
CREATE TABLE ledger (
  account_id text    NOT NULL,
  seq        integer NOT NULL,
  applied_at timestamptz NOT NULL DEFAULT now()
);
// relay-crash.mjs: kills the relay at random moments until the outbox drains,
// then feeds every delivered event through a naive and an idempotent consumer.
import { spawn } from 'node:child_process';
import { once } from 'node:events';
import { readFileSync } from 'node:fs';
import { connect, brokerEvents, resetBroker, sleep } from './lib.mjs';
import { seed } from './seed.mjs';
import { handle } from './consumer.mjs';

await seed();
await resetBroker();
const db = await connect();

let kills = 0;
for (;;) {
  const { rows } = await db.query('SELECT count(*)::int AS n FROM outbox WHERE published_at IS NULL');
  if (rows[0].n === 0) break;
  const relay = spawn(process.execPath, ['relay.mjs', '--drain'], { stdio: 'inherit' });
  const exited = once(relay, 'exit');
  const timer = setTimeout(() => { relay.kill('SIGKILL'); kills++; }, 100 + Math.random() * 300);
  await exited;
  clearTimeout(timer);
  await sleep(200); // let Postgres release the killed session's row locks
}

const events = await brokerEvents();
const duplicates = events.length - new Set(events.map((e) => e.eventId)).size;

await db.query(readFileSync('consumer.sql', 'utf8'));
const naiveApplied = events.length; // a consumer without dedupe applies every delivery
let applied = 0;
for (const e of events) if (await handle(db, e)) applied++;

console.log(
  `kills=${kills} outbox_rows=5000 delivered=${events.length} duplicates=${duplicates} ` +
    `naive_consumer_applied=${naiveApplied} idempotent_consumer_applied=${applied}`,
);
await db.end();
for i in 1 2 3; do node relay-crash.mjs; done
kills=14 outbox_rows=5000 delivered=5667 duplicates=667 naive_consumer_applied=5667 idempotent_consumer_applied=5000
kills=12 outbox_rows=5000 delivered=5509 duplicates=509 naive_consumer_applied=5509 idempotent_consumer_applied=5000
kills=11 outbox_rows=5000 delivered=5431 duplicates=431 naive_consumer_applied=5431 idempotent_consumer_applied=5000
Each kill re-sent part of the batch that was in flight, between 39 and 48 events per kill on average with a batch size of 100. Over three runs, that came to 431 to 667 duplicate deliveries. The naive column is not a separate measurement: a consumer without dedupe applies every delivery, so it equals the delivered count. The idempotent consumer applied exactly 5,000 in every run.
Notice that the dedupe insert and the business write share one transaction. If they ran separately, a crash between them would either drop the event or apply it twice, which is the dual write from Stage 1 again, on the consumer side. For more on how redelivery interacts with retries, see the post on retry storms and the outages they cause.
Smaller batches reduce duplicates per crash, but they also mean more round trips per event. Consequently, batch size is a throughput knob, never a correctness one. Correctness has to come from the consumer.
Stage 6: An Outbox Table Nobody Cleans Up
In the transactional outbox pattern, published rows are dead weight. Nobody deletes them at first, because the table is small and the relay is fast. A year later the table holds millions of rows, and the relay query that used to be instant now scans most of them on every poll.
The Relay Query at Two Million Published Rows
The setup inserts two million published rows and 100 unpublished ones. It then runs the relay’s claim query three times with the partial index from the schema, drops the index, and runs it three more times.
-- bloat-setup.sql
\i schema.sql
-- Two million events that were published and never cleaned up, then 100 waiting
INSERT INTO outbox (aggregate_type, aggregate_id, event_type, payload, published_at)
SELECT 'order', (g % 50000)::text, 'OrderPlaced',
       jsonb_build_object('orderId', g, 'totalCents', 1000 + g % 9000), now()
  FROM generate_series(1, 2000000) AS g;
INSERT INTO outbox (aggregate_type, aggregate_id, event_type, payload)
SELECT 'order', g::text, 'OrderPlaced', '{}' FROM generate_series(1, 100) AS g;
VACUUM ANALYZE outbox;
SELECT pg_size_pretty(pg_table_size('outbox')) AS table_size,
       pg_size_pretty(pg_relation_size('outbox_unpublished_idx')) AS partial_index_size,
       pg_size_pretty(pg_relation_size('outbox_pkey')) AS pkey_size;
-- bloat-query.sql
EXPLAIN (ANALYZE, BUFFERS, COSTS OFF)
SELECT id, aggregate_id, event_type, payload
  FROM outbox
 WHERE published_at IS NULL
 ORDER BY id
 LIMIT 100
   FOR UPDATE SKIP LOCKED;
psql -p 55432 -U postgres -d outbox -q -f bloat-setup.sql
for i in 1 2 3; do psql -p 55432 -U postgres -d outbox -q -f bloat-query.sql; done
psql -p 55432 -U postgres -d outbox -q -c "DROP INDEX outbox_unpublished_idx"
for i in 1 2 3; do psql -p 55432 -U postgres -d outbox -q -f bloat-query.sql; done
 table_size | partial_index_size | pkey_size
------------+--------------------+-----------
 269 MB     | 16 kB              | 43 MB
(1 row)
With the partial index, first run:
                                                  QUERY PLAN
--------------------------------------------------------------------------------------------------------------
 Limit (actual time=0.107..0.191 rows=100.00 loops=1)
   Buffers: shared hit=203
   ->  LockRows (actual time=0.106..0.184 rows=100.00 loops=1)
         Buffers: shared hit=203
         ->  Index Scan using outbox_unpublished_idx on outbox (actual time=0.015..0.044 rows=100.00 loops=1)
               Filter: (published_at IS NULL)
               Index Searches: 1
               Buffers: shared hit=3
 Planning:
   Buffers: shared hit=85 read=8
 Planning Time: 3.559 ms
 Execution Time: 0.246 ms
(12 rows)
Without it, first run:
                                       QUERY PLAN
-----------------------------------------------------------------------------------------
 Limit (actual time=129.703..129.743 rows=100.00 loops=1)
   Buffers: shared hit=14362 read=20317
   ->  LockRows (actual time=129.702..129.738 rows=100.00 loops=1)
         Buffers: shared hit=14362 read=20317
         ->  Sort (actual time=129.590..129.593 rows=100.00 loops=1)
               Sort Key: id
               Sort Method: quicksort  Memory: 30kB
               Buffers: shared hit=14162 read=20317
               ->  Seq Scan on outbox (actual time=129.544..129.556 rows=100.00 loops=1)
                     Filter: (published_at IS NULL)
                     Rows Removed by Filter: 2000000
                     Buffers: shared hit=14159 read=20317
 Planning:
   Buffers: shared hit=82 dirtied=1
 Planning Time: 1.133 ms
 Execution Time: 129.785 ms
(16 rows)
The execution time lines from all six runs:
with partial index:     Execution Time: 0.246 ms | 0.145 ms | 0.163 ms
without partial index:  Execution Time: 129.785 ms | 127.086 ms | 136.720 ms
The partial index held 16 kB, read 3 index pages, and found its 100 rows in 0.15 to 0.25 ms. Without it, Postgres read the whole 269 MB table and discarded two million rows to find the same 100, taking 127 to 137 ms. For a relay that polls every 50 ms, that means scanning the table more or less continuously. The partial index documentation covers this use case directly.
One caveat: planning time varied from 1.0 to 65 ms across the six runs, with no pattern by index. Execution time is the number that tracks table size, so that is the comparison here.
Deleting Published Rows Without Hurting the Relay
The index keeps the relay fast, but the table still grows. A cleanup job should delete published rows past a retention window, in small batches, so it never holds long locks or produces one huge transaction.
-- cleanup.sql: deletes published rows older than the retention window, one short transaction per batch
CREATE OR REPLACE PROCEDURE outbox_cleanup(retention interval, batch_size int DEFAULT 10000)
LANGUAGE plpgsql AS $$
DECLARE
  deleted int;
BEGIN
  LOOP
    DELETE FROM outbox
     WHERE id IN (SELECT id FROM outbox
                   WHERE published_at < now() - retention
                   ORDER BY id
                   LIMIT batch_size);
    GET DIAGNOSTICS deleted = ROW_COUNT;
    COMMIT; -- releases locks between batches so the relay never waits on cleanup
    EXIT WHEN deleted < batch_size;
  END LOOP;
END $$;
On the same two-million-row table, with a retention of zero to delete everything published:
CALL outbox_cleanup(interval '0 seconds');
CALL
Time: 5883.232 ms (00:05.883)

 unpublished | total
-------------+-------
         100 |   100
(1 row)

VACUUM
Time: 460.068 ms

 table_size
------------
 269 MB
(1 row)
The procedure removed two million rows in 5.9 seconds and left the 100 unpublished rows alone. Notably, the table stayed at 269 MB after a plain VACUUM. Vacuum marks the space as reusable for new rows rather than returning it to the operating system. That is fine for an outbox in steady state, because new events fill the freed space. Shrinking the file requires VACUUM FULL, which locks the table, so it is better avoided on a live outbox.
At high volume, partitioning the outbox by day and dropping old partitions avoids row-by-row deletes entirely. That approach was not tested here, so treat it as an option to evaluate rather than a measured recommendation.
Stage 7: Moving to CDC and Forgetting the Slot
Eventually polling feels wasteful, and the team switches to change data capture. Debezium reads the outbox inserts from the Postgres write-ahead log, and its outbox event router turns each insert into a Kafka message. There is no polling query, and no published_at column, since the router does not allow updates to outbox rows.
CDC brings its own failure mode, though. Debezium reads the log through a logical replication slot, and a slot keeps every byte of WAL its consumer has not confirmed. If the connector stops, Postgres keeps the WAL anyway.
What an Idle Slot Holds
The script below creates the same kind of slot Debezium creates, with the built-in pgoutput plugin, and then writes a million outbox rows while nothing reads from it.
-- slot.sql
\i schema.sql
SHOW max_slot_wal_keep_size;
-- What Debezium creates on first start: a logical slot using the built-in pgoutput plugin
SELECT slot_name FROM pg_create_logical_replication_slot('outbox_cdc', 'pgoutput');

-- The connector is now stopped. The application keeps writing outbox rows.
INSERT INTO outbox (aggregate_type, aggregate_id, event_type, payload)
SELECT 'order', g::text, 'OrderPlaced', jsonb_build_object('orderId', g)
  FROM generate_series(1, 1000000) AS g;
CHECKPOINT;

SELECT slot_name, active, wal_status,
       pg_size_pretty(pg_wal_lsn_diff(pg_current_wal_lsn(), restart_lsn)) AS wal_held
  FROM pg_replication_slots;
-- slot-cap.sql: cap the WAL any slot may hold, then let a checkpoint enforce it
ALTER SYSTEM SET max_slot_wal_keep_size = '64MB';
SELECT pg_reload_conf();
SELECT pg_sleep(1);
SHOW max_slot_wal_keep_size;
INSERT INTO outbox (aggregate_type, aggregate_id, event_type, payload)
SELECT 'order', g::text, 'OrderPlaced', '{}' FROM generate_series(1, 200000) AS g;
CHECKPOINT;
SELECT slot_name, active, wal_status, invalidation_reason,
       pg_size_pretty(pg_wal_lsn_diff(pg_current_wal_lsn(), restart_lsn)) AS wal_held
  FROM pg_replication_slots;
psql -p 55432 -U postgres -d outbox -q -f slot.sql
psql -p 55432 -U postgres -d outbox -q -f slot-cap.sql
### psql -f slot.sql
 max_slot_wal_keep_size
------------------------
 -1
(1 row)

 slot_name
------------
 outbox_cdc
(1 row)

 slot_name  | active | wal_status | wal_held
------------+--------+------------+----------
 outbox_cdc | f      | reserved   | 252 MB
(1 row)

### psql -f slot-cap.sql
 pg_reload_conf
----------------
 t
(1 row)

 pg_sleep
----------

(1 row)

 max_slot_wal_keep_size
------------------------
 64MB
(1 row)

 slot_name  | active | wal_status | invalidation_reason | wal_held
------------+--------+------------+---------------------+----------
 outbox_cdc | f      | lost       | wal_removed         |
(1 row)
With the default max_slot_wal_keep_size of -1, an inactive slot held 252 MB of WAL after one million small events. Moreover, nothing caps it: the slot keeps everything until the connector returns or someone drops the slot. A connector stopped over a long weekend on a busy database can fill the disk, and a full pg_wal disk stops all writes.
With a 64 MB cap, the next checkpoint invalidated the slot (wal_status = lost, invalidation_reason = wal_removed). The database is safe, but the connector can no longer resume from that slot. Recovering means creating a new slot and running a fresh snapshot, and any events written in between must come from the outbox table itself. Therefore, if you set the cap, keep outbox rows long enough to replay that gap.
Postgres 18 also offers idle_replication_slot_timeout, which invalidates a slot that stays inactive longer than the setting. It defaults to 0, meaning off. Both settings are described in the PostgreSQL 18 replication configuration docs. Whichever you pick, alert on pg_replication_slots long before either one fires.
Debezium Outbox Router Configuration
The router expects column names aggregatetype, aggregateid, type and payload by default. The schema in this post uses snake_case names, so the mapping has to be explicit. Note that the configuration below follows the option names in the Debezium 3.7 documentation. It was not run as part of this test.
{
  "name": "orders-outbox",
  "config": {
    "connector.class": "io.debezium.connector.postgresql.PostgresConnector",
    "plugin.name": "pgoutput",
    "slot.name": "outbox_cdc",
    "database.hostname": "orders-db",
    "database.port": "5432",
    "database.user": "debezium",
    "database.password": "${file:/secrets/orders-db.properties:password}",
    "database.dbname": "orders",
    "topic.prefix": "orders",
    "table.include.list": "public.outbox",
    "transforms": "outbox",
    "transforms.outbox.type": "io.debezium.transforms.outbox.EventRouter",
    "transforms.outbox.table.field.event.id": "id",
    "transforms.outbox.table.field.event.key": "aggregate_id",
    "transforms.outbox.table.field.event.payload": "payload",
    "transforms.outbox.route.by.field": "aggregate_type",
    "transforms.outbox.table.fields.additional.placement": "event_type:header:eventType"
  }
}
Using aggregate_id as the message key sends every event of one aggregate to the same Kafka partition. That gives CDC the per-aggregate ordering that Stage 4 had to build by hand. Because the connector reads the insert from the WAL, the outbox row can be deleted afterwards, and the router filters out the resulting DELETE events.
Polling Relay or CDC: Which Should You Run?
Both are valid ways to run the transactional outbox pattern. The difference is mostly what you have to operate and what you have to watch.
| Factor | Polling relay | CDC with Debezium |
|---|---|---|
| Extra infrastructure | None beyond the app | Kafka Connect cluster, connector config |
| Publish latency | Poll interval plus batch time | Close to commit time |
| Load on the database | One indexed query per poll | WAL decoding, slot retention |
| Ordering per aggregate | Needs partitioned relays (Stage 4) | Message key on aggregate_id |
| Failure to watch | Relay stopped, outbox backlog grows | Slot inactive, WAL grows on the primary |
| Brokers supported | Anything with a client library | Kafka-centric, other sinks via Debezium Server |
| Best fit | Small to mid teams, modest volume | Kafka already in place, high volume |
For most teams, start with the polling relay from Stage 4. It needs no new infrastructure, its failure shows up as a growing backlog in a table you already monitor, and the tests above cover its sharp edges. Move to CDC when the poll latency or the polling load starts to matter, or when Kafka Connect already runs for other reasons.
Real-World Scenario: Scaling an Order Service to Three Replicas
A common path looks like this. A small backend team runs an order service as a single container and adopts the transactional outbox pattern early, with the relay as a background loop inside the same process. It works for months. Then, ahead of a seasonal peak, the team scales the deployment to three replicas for availability.
Nothing fails loudly. Instead, the warehouse service starts reserving stock twice for some orders, and the customer notification service sends duplicate confirmation emails. Both consumers assumed one delivery per event. The relay query had no row locks, so all three replicas published the same batches, much like the naive runs above.
The first fix is usually adding FOR UPDATE SKIP LOCKED, and the duplicates stop. A few days later, a different bug appears: some orders show as “shipped” and then flip back to “paid” in the customer portal. The read model applies status events in arrival order, and the three relays now interleave them, which matches the Stage 4 results.
The lasting fix takes two changes, usually over a week or two. First, the relay moves out of the API pods into its own small deployment, with one instance per hash partition. Second, every consumer records processed event ids in the same transaction as its side effect. The trade-off is one more deployment to run, plus a processed_events table per consumer that also needs a retention job.
When to Use the Transactional Outbox Pattern
- A database change and an outgoing event must agree, and losing either one has a business cost
- The broker cannot join a distributed transaction with your database, which covers Kafka, RabbitMQ, SQS and most others
- You run choreographed workflows, such as the saga pattern for distributed transactions, where each step publishes the event that triggers the next one
- Consumers can be made idempotent, or already are
- Downstream services build read models that must eventually match the source of truth
When NOT to Use the Transactional Outbox Pattern
- The event is a hint, such as a cache invalidation, and a lost one costs a stale read for a few seconds
- The service has no database transaction to piggyback on, for example a stateless gateway
- Your state already lives in an event log, as in event sourcing, where the log itself is the record and the outbox would duplicate it
- Consumers need the event within single-digit milliseconds and cannot tolerate a polling delay or a CDC pipeline
- The team cannot operate the relay or the connector, in which case a simpler, well-understood loss window may be the more honest choice
Common Mistakes With the Transactional Outbox Pattern
- Writing the outbox row on a different connection or ORM session than the business change, which quietly recreates the dual write
- Tracking progress with
id > last_seen_id, which skipped 28 to 30 percent of events under concurrent writes in the tests above - Running the relay inside every API replica without row locks or partitioning
- Using SKIP LOCKED and assuming it preserves order per aggregate
- Treating delivery as exactly-once and skipping consumer dedupe
- Leaving out the partial index on unpublished rows, then blaming Postgres when the relay slows down
- Never deleting published rows, or deleting them in one giant transaction
- Running Debezium without an alert on inactive replication slots or a
max_slot_wal_keep_sizelimit - Putting the whole aggregate into the payload, so a schema change in the table breaks every consumer at once
What Was Not Measured
These tests ran on one Windows machine against a local Postgres, with a stand-in HTTP broker instead of Kafka or RabbitMQ. Real broker latency would widen the dual-write gap in Stage 1 and slow the relay, but it would not change which designs lose, duplicate or reorder events. Durability settings were left at their defaults, so fsync was on throughout.
Not covered: LISTEN/NOTIFY to wake the relay instead of polling, table partitioning for cleanup, Debezium end-to-end latency, and throughput limits of the relay itself. The Debezium configuration above comes from the 3.7 documentation and was not run here. Stage 7 ran once, because WAL retention from a fixed workload does not vary between runs in a meaningful way.
Conclusion
The transactional outbox pattern replaces two-phase commit with one local transaction and a relay, and in these tests that removed every lost and phantom event that the dual write produced. What it does not remove is the work after the commit. The relay has to claim rows by state, lock them, and keep each aggregate on one instance, the consumers have to deduplicate, and the table or the replication slot needs watching.
Start with the partitioned polling relay and an idempotent consumer, add the partial index and the cleanup procedure on day one, and move to CDC only when you have a reason. If consumers are already falling behind once the events flow, the guide to diagnosing Kafka consumer lag is the natural next read.